
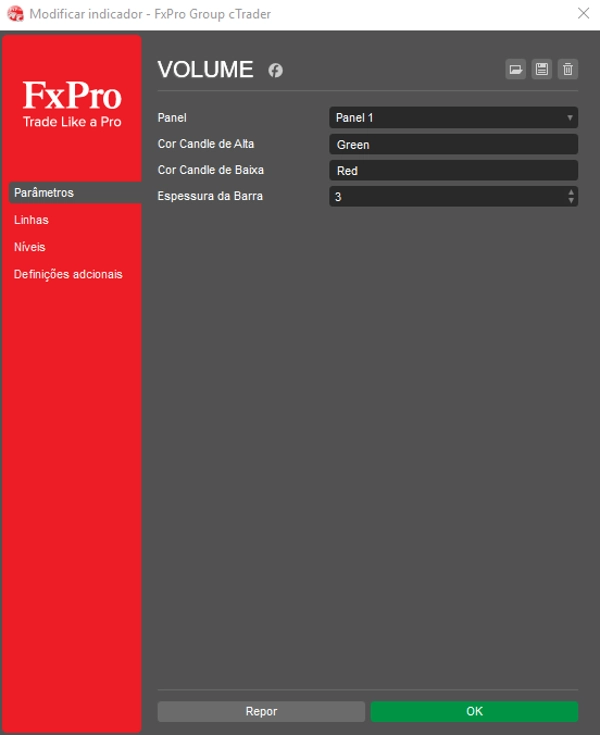
VolumeColorBar
Wskaźnik
10 zakupy
Wersja 1.2, Apr 2026
Windows, Mac
4.3
Opinie: 3
Opis
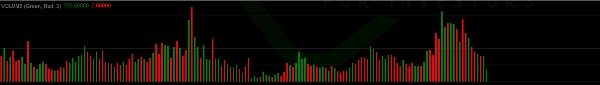
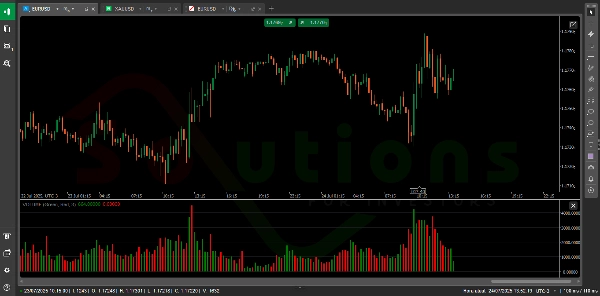
VolumeColorBar to potężne narzędzie, które wizualnie przedstawia wolumen rynku za pomocą kolorowych słupków opartych na kierunku świecy. Zielone słupki wskazują wolumen na byczych świecach (presja kupujących), podczas gdy czerwone słupki odzwierciedlają wolumen na niedźwiedzich świecach (presja sprzedających). Pozwala to traderom natychmiast ocenić, czy aktywność rynkowa jest napędzana bardziej przez kupujących czy sprzedających — pomagając potwierdzić wybicia, zidentyfikować odwrócenia i poprawić timing transakcji z większą pewnością.
Podsumowanie
Podsumowanie AI
VolumeColorBar is a trading indicator that visualizes market volume using color-coded bars aligned with candle direction. It displays green bars for volume on bullish candles, indicating buying pressure, and red bars for volume on bearish candles, indicating selling pressure. This visual representation helps traders quickly assess whether market activity is dominated by buyers or sellers. The indicator supports various markets and symbols, including Forex pairs (EURUSD, GBPUSD, NZDUSD, USDJPY), cryptocurrencies (BTCUSD, crypto), commodities (XAUUSD, gold, oil, silver), indices (NAS100, SP500, DAX, Dow), and stocks. By providing immediate insight into volume dynamics relative to price movement, VolumeColorBar aids in confirming breakouts, identifying potential reversals, and improving trade timing decisions.
Profil wskaźnika
Opinie klientów
4.3
Opinie: 3
5 | 33 % | |
4 | 67 % | |
3 | 0 % | |
2 | 0 % | |
1 | 0 % |
Opinie klientów
April 14, 2025
Clean tool for workflow for a more controlled workflow. It helps with planning entries around the first range, but false breaks still need filtering. I would track 20 market opens, the first 30 to 60 minutes and a target near 1.5R. I would still keep manual review in the process.
April 13, 2025
April 13, 2025
Worth a closer look around opening range breakouts. The useful part is planning entries around the first range, with the numbers checked before scaling. The setup should be tested across at least 15 sessions because 2 or 3 fakeouts can change the picture. The trade idea is clear, but it needs a hard stop and a defined breakout rule.
Dyskusja
Częste pytania
BTCUSD
Forex
Signal
Breakout
Indices
EURUSD
Commodities
GBPUSD
NZDUSD
Prop
Crypto
Stocks
XAUUSD
NAS100
USDJPY
Produkty dostępne za pośrednictwem cTrader Store, w tym boty handlowe, wskaźniki i wtyczki, dostarczane są przez deweloperów zewnętrznych i udostępniane wyłącznie w celach informacyjnych oraz w celu zapewnienia dostępu technicznego. cTrader Store nie jest brokerem i nie zapewnia doradztwa inwestycyjnego, nie udziela spersonalizowanych rekomendacji ani nie gwarantuje przyszłych wyników.


Cena
Od 05/02/2025
31
Sprzedaż