
Automatic Fibonatti
Wskaźnik
3 zakupy
Wersja 1.2, Apr 2026
Windows, Mac
5.0
Opinie: 2
Opis
Auto Fibonacci dla cTrader
Automatycznie identyfikuj kluczowe poziomy cenowe — w pełni dostosowane do Twojej strategii.
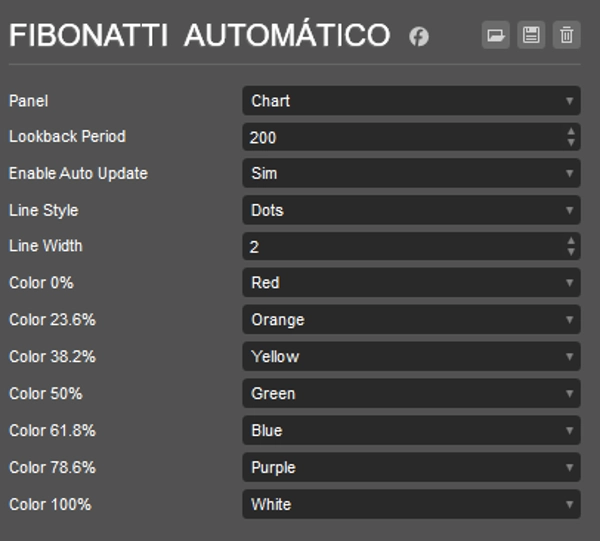
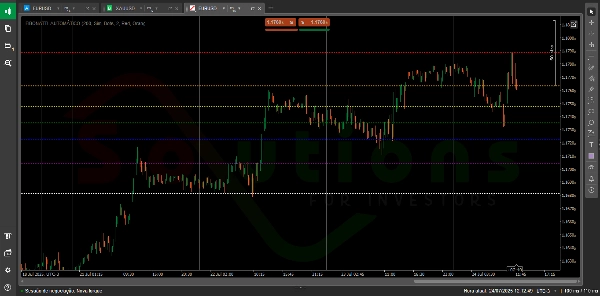
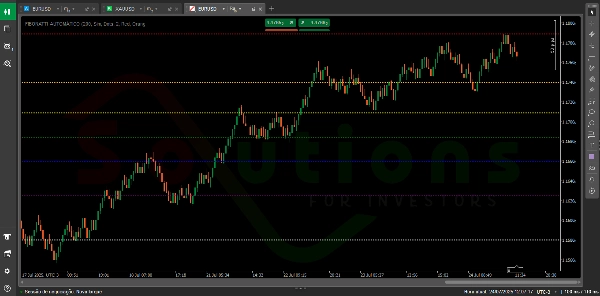
Auto Fibonacci to inteligentny i elastyczny wskaźnik, który automatycznie rysuje poziomy zniesień Fibonacciego na podstawie najwyższych i najniższych cen w okresie zdefiniowanym przez użytkownika. Co go wyróżnia, to pełna personalizacja: dostosuj każdy poziom Fibonacciego pod względem koloru, stylu linii i grubości, aby odpowiadał Twoim preferencjom wizualnym i strategii handlowej. Posiada także aktualizacje w czasie rzeczywistym, dzięki czemu Twój wykres zawsze odzwierciedla najnowsze ruchy cen — bez potrzeby ręcznych korekt.
Podsumowanie
Profil wskaźnika
Opinie klientów
5.0
Opinie: 2
5 | 100 % | |
4 | 0 % | |
3 | 0 % | |
2 | 0 % | |
1 | 0 % |
Opinie klientów
March 7, 2025
The product earns time when it gives the trader a reason to pause. It should not replace the chart.
February 28, 2025
there is less room for random clicking, but manual context is still required.
Dyskusja
Częste pytania
BTCUSD
Forex
Signal
Indices
EURUSD
Commodities
GBPUSD
NZDUSD
Fibonacci
Prop
Scalping
Crypto
Stocks
XAUUSD
NAS100
USDJPY
Produkty dostępne za pośrednictwem cTrader Store, w tym boty handlowe, wskaźniki i wtyczki, dostarczane są przez deweloperów zewnętrznych i udostępniane wyłącznie w celach informacyjnych oraz w celu zapewnienia dostępu technicznego. cTrader Store nie jest brokerem i nie zapewnia doradztwa inwestycyjnego, nie udziela spersonalizowanych rekomendacji ani nie gwarantuje przyszłych wyników.


Cena
Od 05/02/2025
31
Sprzedaż