Opis
🔥 Opis wskaźnika
Swing Profile cTrader to zaawansowany wskaźnik wizualny łączący kilka narzędzi w jednym:
- Wykrywanie swingów
- Strukturalny ZigZag
- Profil wolumenu pojedynczego swingu
- PoC (Punkt Kontroli)
- Szacowana delta wolumenu
- Opcjonalna średnia krocząca
Idea jest prosta, ale bardzo potężna:
zamiast patrzeć tylko na cenę, wskaźnik pokazuje gdzie wolumen był skoncentrowany w każdej nodze swingu.
W praktyce nie mówi tylko:
„cena poszła w górę lub w dół”
mówi też:
„który obszar wewnątrz tego swingu był prawdziwym polem bitwy między kupującymi a sprzedającymi.”
To jest jego prawdziwa zaleta. 🚀
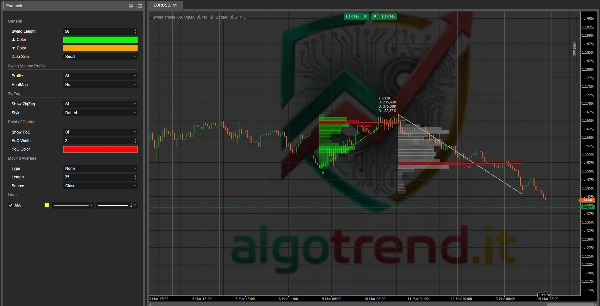
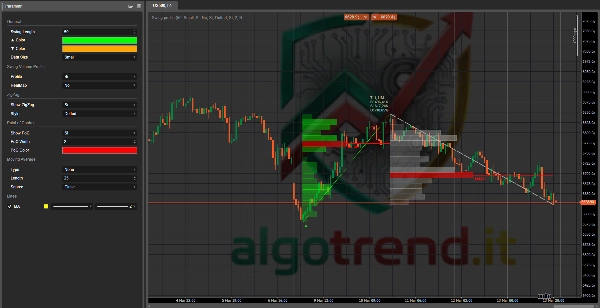
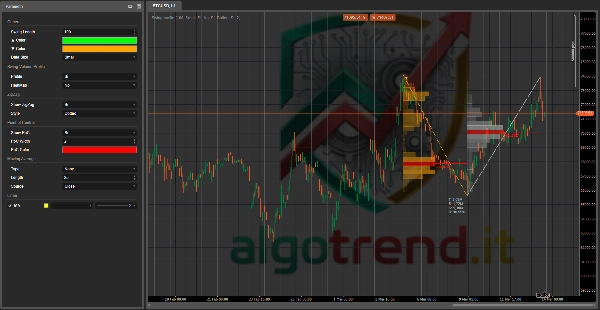
Swing Profile cTrader to zaawansowany wskaźnik analizujący strukturę cenową przez dynamiczne swingi, logikę ZigZag i profilowanie wolumenu dla każdej pojedynczej nogi rynku.
Dla każdego swingu podkreśla rozkład wolumenu, identyfikuje Punkt Kontroli i szacuje równowagę między kupującymi a sprzedającymi przez deltę wolumenu. Pozwala to traderom precyzyjniej identyfikować strefy równowagi, ukryte poziomy wsparcia i oporu, obszary kontynuacji oraz potencjalne wyczerpanie trendu.
Opcjonalna integracja średniej kroczącej sprawia, że wskaźnik nadaje się zarówno do dyskrecjonalnej analizy wykresu, jak i do bardziej strukturalnego filtrowania kierunkowego.
🧠 Co pokazuje na wykresie
1) ZigZag
Linia ZigZag łączy główne szczyty i dołki swingów.
Pomaga Ci:
- zobaczyć strukturę rynku
- odróżnić nogi impulsowe od korekcyjnych
- zrozumieć, czy rynek tworzy:
-
- wyższe szczyty / wyższe dołki
- lub niższe szczyty / niższe dołki
Jak to czytać
- ZigZag z rosnącymi swingami = struktura bycza
- ZigZag z opadającymi swingami = struktura niedźwiedzia
- krótki, chaotyczny ZigZag = rynek nieuporządkowany / boczny
2) Profil wolumenu swingu
To jest sedno wskaźnika 💥
Dla każdego zakończonego swingu wskaźnik buduje pionowy profil wolumenu rozłożony na strefy cenowe.
Każdy poziomy blok reprezentuje:
- zakres cenowy
- z większym lub mniejszym wolumenem obrotu w tym zakresie
Jak to czytać
- dłuższe bloki = więcej wolumenu w tym obszarze
- krótsze bloki = mniej wolumenu w tym obszarze
Dzięki temu możesz od razu zrozumieć:
- gdzie rynek zaakceptował cenę
- gdzie rynek odrzucił cenę
- gdzie mogą istnieć ukryte wsparcia/opory
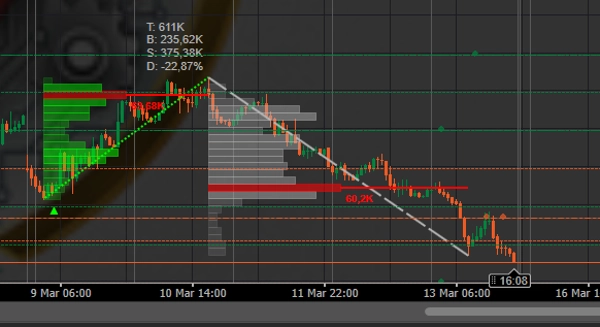
3) PoC – Punkt Kontroli
PoC to strefa cenowa z najwyższym wolumenem w obrębie swingu.
To obszar, w którym wystąpiła największa koncentracja aktywności.
Znaczenie handlowe
PoC często jest:
- magnesem dla ceny
- strefą tymczasowej równowagi
- przyszłym obszarem wsparcia/oporu
Zasada praktyczna
- powyżej PoC = rynek ma tendencję do utrzymania siły
- poniżej PoC = rynek ma tendencję do utraty siły
- powrót do PoC = kluczowy obszar do obserwacji reakcji lub wybicia
4) Delta wolumenu
W panelu tekstowym znajdziesz:
- T = całkowity wolumen
- B = wolumen kupna
- S = wolumen sprzedaży
- D = procentowa delta wolumenu
W twoim kodzie delta jest szacowana tak:
- słupek byczy → wolumen liczony jako kupno
- słupek niedźwiedzi → wolumen liczony jako sprzedaż
Nie jest to prawdziwa profesjonalna delta order-flow, ale nadal bardzo przydatna jako narzędzie do odczytu presji.
Jak to czytać
- pozytywna delta = dominuje presja byków
- negatywna delta = dominuje presja niedźwiedzi
- delta bliska zeru = równowaga / niezdecydowanie
5) Opcjonalna średnia krocząca
Średnia krocząca działa jako filtr kierunkowy.
Możesz jej używać, aby unikać handlu przeciwko szerszemu trendowi.
Proste zastosowanie
- cena powyżej MA = preferencja długiej pozycji
- cena poniżej MA = preferencja krótkiej pozycji
📖 Jak czytać to poprawnie
A. Najpierw przeczytaj strukturę
Pierwsze pytanie nie brzmi „Czy powinienem wejść?”
Pierwsze pytanie brzmi:
czy rynek buduje strukturę byczą, niedźwiedzią czy boczną?
Spójrz na ZigZag:
- wyższe szczyty + wyższe dołki = bycze
- niższe szczyty + niższe dołki = niedźwiedzie
- chaotyczne, skompresowane swingi = zakres boczny
Jeśli nie rozumiesz struktury, nie używaj sygnałów.
B. Następnie przeczytaj, gdzie wolumen był skoncentrowany
Spójrz na profil ostatnio zakończonego swingu.
Zadaj sobie pytanie:
- czy wolumen był skoncentrowany na górze?
- w środku?
- na dole?
Interpretacja
- wolumen skoncentrowany w górnej części byczego swingu
= kupujący są nadal aktywni, zdrowy swing - wolumen skoncentrowany w dolnej części byczego swingu
= słabszy impuls, możliwa późna odbudowa, ale niższa jakość - wolumen skoncentrowany w górnej części niedźwiedziego swingu
= dystrybucja i presja sprzedaży zaczynająca się od wyższych cen - wolumen skoncentrowany w dolnej części niedźwiedziego swingu
= trend już się wydłużył, ryzyko wyczerpania
C. Na koniec obserwuj PoC
PoC często jest prawdziwym kluczem do transakcji.
Jeśli cena wraca do PoC:
może się zdarzyć jedna z tych 3 rzeczy:
- odbicie
- konsolidacja
- przełamanie i przyspieszenie
Oznacza to, że PoC powinien być traktowany jako:
- dynamiczne wsparcie/opór
- obszar retestu
- poziom decyzyjny
🎯 Główne sygnały do wykorzystania
1) Retest PoC w trendzie
To jeden z najlepszych sygnałów ✅
Scenariusz długi
- struktura bycza
- byczy swing z dobrą deltą
- cena cofa się
- cena wraca blisko PoC poprzedniego swingu
- PoC się utrzymuje
Sygnał: możliwa kontynuacja długiej pozycji
Scenariusz krótki
- struktura niedźwiedzia
- niedźwiedzi swing z negatywną deltą
- cena odbija się
- cena wraca do PoC poprzedniego swingu
- PoC odrzuca cenę
Sygnał: możliwa kontynuacja krótkiej pozycji
👉 To jeden z najinteligentniejszych sposobów użycia wskaźnika.
2) Przełamanie PoC
Jeśli cena zdecydowanie przełamuje PoC, często oznacza to zmianę równowagi poprzedniego swingu.
Jak to czytać
- czyste przełamanie PoC + zamknięcie poza nim = możliwa zmiana presji
- fałszywe przełamanie + natychmiastowy powrót do środka = fałszywe wybicie
Przydatna wskazówka
Nie patrz tylko na samo przełamanie.
Obserwuj jak cena zachowuje się, gdy wraca do PoC.
Retest po wybiciu jest często cenniejszy niż samo wybicie.
3) Reakcja w obszarach niskiego wolumenu
Strefy, gdzie profil jest wąski, to obszary o niskim zainteresowaniu.
Gdy cena przez nie przechodzi:
- często przyspiesza
- często szybko je przekracza
Praktyczne zastosowanie
Jeśli cena wchodzi w obszar niskiego wolumenu:
- nie oczekuj dużej stabilności
- oczekuj łatwiejszego ruchu
To doskonałe obszary na:
- cele
- przyspieszenia
- impulsowe wybicia
4) Dywergencja delty
Teraz przechodzimy do prawdziwych sztuczek 😏
Klasyczny przypadek niedźwiedzi
- cena robi byczy swing
- ale delta się nie poprawia
- lub się pogarsza
- lub końcowy impuls dzieje się przy słabym wolumenie
To może sygnalizować:
- wyczerpanie
- kruchy ruch w górę
- możliwą odwrótkę lub korektę
Przypadek byczy
- cena spada
- ale niedźwiedzia delta nie rośnie znacząco
- profil się kompresuje
- PoC przesuwa się wyżej lub się utrzymuje
To może sygnalizować:
- zmęczenie sprzedaży
- możliwą odwrótkę
5) Silne swingi kontra słabe swingi
Nie wszystkie swingi są równe.
Silny swing
- dobrze zdefiniowany profil
- wyraźny PoC
- spójny wolumen
- delta zgodna z kierunkiem
- czysty ZigZag
Słaby swing
- rozproszony wolumen
- nieuporządkowany profil
- nieprzekonująca delta
- zdezorganizowana struktura
👉 Najlepsze sygnały pochodzą z silnych swingów, nie z brzydkich.
🧩 Prawdziwe sztuczki, aby lepiej go używać
Sztuczka 1: nigdy nie używaj PoC samodzielnie
Sam PoC nie wystarczy.
PoC działa najlepiej, gdy jest zgodny z:
- poziomem wsparcia/oporu poziomego
- szczytem/dołkiem swingu
- średnią kroczącą
- linią trendu
- poziomem psychologicznym
Im więcej zbieżności, tym silniejszy sygnał.
Sztuczka 2: patrz, gdzie swing zaczął się budować
Nie zatrzymuj się na całkowitym wolumenie.
Spójrz na miejsce wewnątrz swingu, gdzie wolumen był skoncentrowany.
Przykład
Byczy swing z bardzo niskim PoC:
- może oznaczać wczesną akumulację, po której następuje ekspansja
- często dobre, ale uważaj na głębokie cofnięcia
Byczy swing z bardzo wysokim PoC:
- może oznaczać, że rynek zaakceptował wyższe ceny
- bardzo bycze, jeśli cena pozostaje powyżej niego później
Sztuczka 3: najlepsze transakcje często są przy powrocie, nie na początku
Wielu traderów wchodzi, gdy widzi silną świecę.
Często jest to już za późno.
Z tym wskaźnikiem możesz poczekać na:
- impulsowy swing
- identyfikację PoC
- powrót ceny
- potwierdzenie utrzymania lub odrzucenia
To daje czystsze wejścia i lepsze ustawienie stopa.
Sztuczka 4: używaj nogi na żywo ostrożnie
Noga na żywo jest przydatna, ale też najbardziej niestabilna.
Dlatego w kodzie uczyniliśmy ją opcjonalną.
Zasada
- zakończone swingi = bardziej wiarygodne
- swingi na żywo = bardziej reaktywne, ale głośniejsze
Jeśli chcesz precyzji, daj większą wagę zakończonym swingom.
Sztuczka 5: nie myl wysokiego wolumenu z silnym sygnałem
Wysoki wolumen nie oznacza automatycznie odwrócenia lub kontynuacji.
Wysoki wolumen oznacza tylko:
że rynek zwrócił tam dużo uwagi.
Następnie musisz zrozumieć, czy ten obszar to:
- akumulacja
- dystrybucja
- absorpcja
- równowaga
Sztuczka 6: używaj delty jako potwierdzenia, nie jako szefa
Delta tutaj jest szacunkowa, nie jest prawdziwym footprintem.
Dlatego powinna być używana tak:
- nigdy sama
- tak, jako potwierdzenie
- tak, do porównania jednego swingu z poprzednim
✅ Jak używać go operacyjnie
Idealne ustawienie długie
- struktura bycza
- cena powyżej MA
- byczy swing z dobrym wolumenem
- pozytywna lub poprawiająca się delta
- cofnięcie w kierunku PoC lub obszaru o wysokim wolumenie
- bycza reakcja na poziomie
Wejście:
- po potwierdzeniu reakcji
Stop:
- poniżej swingu lub poniżej PoC, w zależności od agresywności
Cel:
- poprzedni szczyt
- strefa niskiego wolumenu
- wydłużenie swingu
Idealne ustawienie krótkie
- struktura niedźwiedzia
- cena poniżej MA
- niedźwiedzi swing z dobrym wolumenem
- negatywna lub pogarszająca się delta
- odbicie w kierunku PoC
- niedźwiedzie odrzucenie z obszaru
Wejście:
- po potwierdzeniu odrzucenia
Stop:
- powyżej swingu lub powyżej PoC
Cel:
- poprzedni dołek
- strefa niskiego wolumenu
- nowe wydłużenie
⚠️ Kiedy NIE używać
Unikaj lub zmniejszaj wagę sygnałów, gdy:
- rynek jest płaski i boczny
- swingi są zbyt małe
- symbol ma niewiarygodny wolumen tickowy
- interwał czasowy jest zbyt niski i zbyt hałaśliwy
- zbliżają się ważne wiadomości
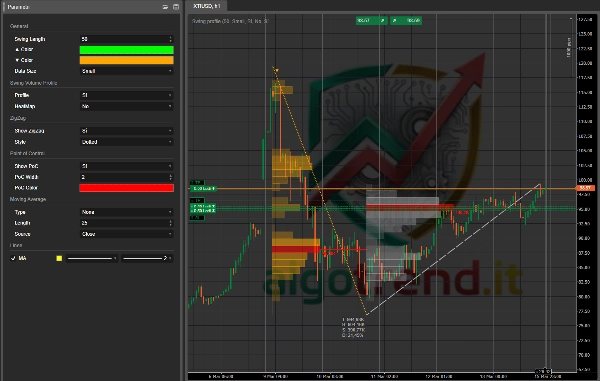
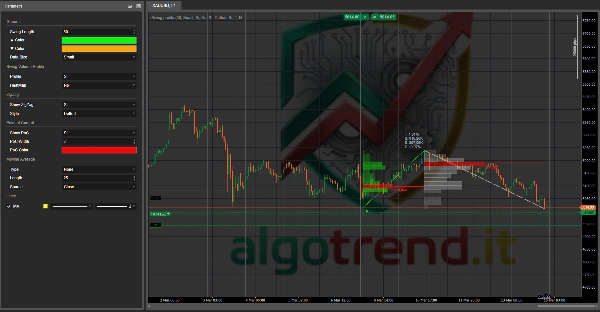
🛠️ Zalecane ustawienia
Dla intraday
- Długość swingu: 20–40
- Liczba świec wstecz: 300–500
- Maksymalna liczba przedziałów: 30–50
- Pokaż nogę na żywo: false
- Mapa ciepła: false
Dla swing tradingu
- Długość swingu: 50–80
- Liczba świec wstecz: 500–800
- Maksymalna liczba przedziałów: 40–60
Dla czystego wykresu
- Profil: true
- Mapa ciepła: false
- Pokaż ZigZag: true
- Pokaż PoC: true
📌 Super praktyczne podsumowanie
Zawsze czytaj to w tej kolejności:
1. struktura
trend czy zakres boczny?
2. swing
jaki jest najnowszy ważny swing?
3. profil
gdzie był skoncentrowany wolumen?
4. PoC
gdzie jest prawdziwa równowaga swingu?
5. delta
czy presja to potwierdza, czy nie?
6. kontekst
czy poziom jest zgodny z innymi zbieżnościami?
Podsumowanie
Key features include the Point of Control (PoC), representing the price zone with the highest volume within a swing, which acts as a dynamic support/resistance and equilibrium level. The indicator estimates delta volume by categorizing volume on bullish bars as buy volume and on bearish bars as sell volume, providing insights into buying or selling pressure. An optional moving average serves as a directional filter to align trades with broader trends.
Users can interpret volume concentration within swings to assess market strength, potential reversals, or trend exhaustion. The indicator supports various markets including Forex, indices, commodities, stocks, and cryptocurrencies such as BTCUSD and EURUSD. It is suitable for intraday and swing trading with configurable parameters for swing length, lookback bars, and volume bins. The tool aids in identifying key trade signals like PoC retests, breakouts, low-volume area reactions, and delta divergences for more informed trading decisions.


