Descrizione
Analisi adattativa delle tendenze utilizzando la matematica della regressione pesata con kernel.
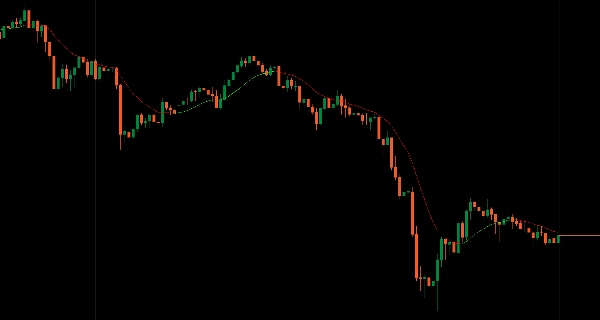
Applica un peso con kernel gaussiano dove le barre vicine influenzano di più e le barre lontane svaniscono esponenzialmente, creando linee di tendenza ultra-lisce senza ritardo a periodo fisso.
Regolazione automatica alla struttura locale dei prezzi, ritardo minimo rispetto alle medie mobili tradizionali, codifica colore dinamica (Lime per tendenza al rialzo, Rosso per tendenza al ribasso), larghezza di banda regolabile per la messa a punto della reattività, finestra di lookback flessibile (50-2000 barre) e design a due colori senza rumore offrono un'identificazione della tendenza matematicamente precisa per i trader che cercano una levigatura adattativa senza selezione arbitraria del periodo.
CARATTERISTICHE
Calcolo Pesato con Kernel
- Le barre vicine influenzano di più, le barre lontane svaniscono esponenzialmente—nessun periodo fisso arbitrario
- Peso con kernel gaussiano per una levigatura matematicamente ottimale
- Si adatta automaticamente alla struttura locale dei prezzi senza ricalibrazione manuale
- Ritardo minimo: risponde più rapidamente ai cambiamenti genuini di tendenza rispetto alle medie mobili equivalenti
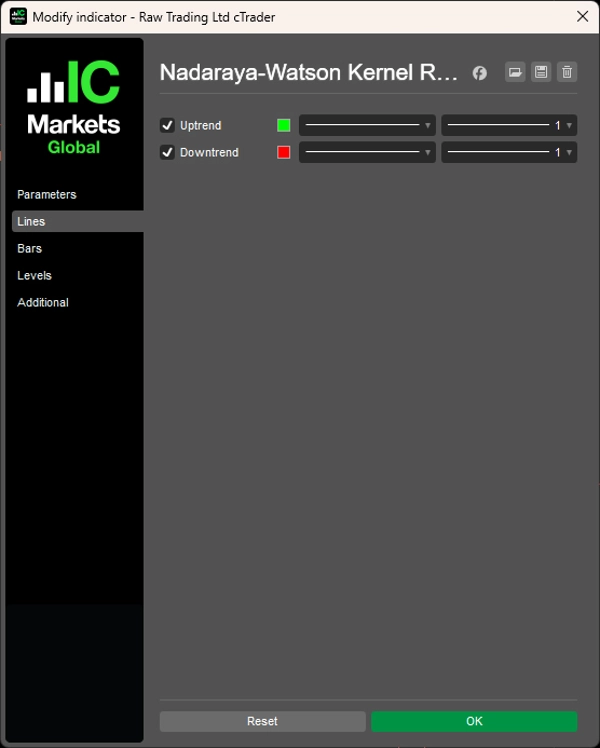
Codifica Colore Dinamica
- Lime: Tendenza al rialzo
- Rosso: Tendenza al ribasso
- Conferma visiva istantanea della direzione della tendenza
- Visualizzazione della linea discontinua: i cambiamenti di colore sono istantanei e visivamente chiari
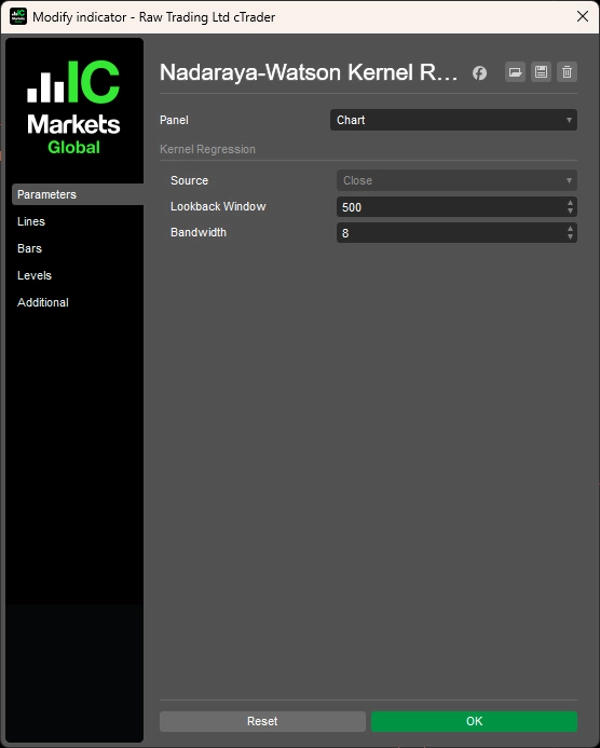
Parametri Regolabili
- Larghezza di banda: regola finemente la reattività rispetto alla levigatezza
- Finestra di lookback flessibile: 50-2000 barre per adattarsi al tuo intervallo temporale
- Si adatta a diverse condizioni di mercato e stili di trading
Design Pulito
- Due colori, zero ingombro—sia in tendenza al rialzo che al ribasso
- Identificazione della tendenza senza rumore
- Nessuna impostazione complessa richiesta
- Semplicità visiva con precisione matematica
__________________________________________________________________________________________
ALTRI INDICATORI GRATUITI
Esplora un'ampia gamma di strumenti di analisi di mercato—dalla struttura e volume alla regressione, volatilità e intervalli temporali personalizzati.
Il codice sorgente è disponibile nel repository GitHub.
Tutti gratuiti da usare. Ma se vuoi offrire un supporto "caffè", puoi farlo qui.
Supporto/Resistenza
Volume
- Profiler di Attività di Volume
- Analizzatore di Efficienza del Volume
- Analisi del Profilo di Volume
- Profilo di Volume - Aggiornato
- Analisi della Distribuzione del Volume
- VWAP (Prezzo Medio Ponderato per il Volume)
Medie Mobili
- Canale SSL
- Media Mobile Ancorata
- Media Mobile Scalata per Deviazione
- Attivatore Gann High Low
- Linea di Tendenza Istantanea
- Media Mobile Adattativa di Kaufman con Visione della Tendenza
- Canale Media Mobile
- Suite di Medie Mobili
- Media Mobile del Canale di Tendenza
Utilità/Personalizzati
- Strumenti per il Grafico
- Intervalli Temporali Personalizzati
- Candlestick di Intervallo Temporale Superiore
Basato su Regressione
Volatilità
Oscillatori
__________________________________________________________________________________________
DICHIARAZIONE DI NON RESPONSABILITÀ
Il trading comporta rischi. Questo indicatore è destinato esclusivamente all'analisi tecnica — applica sempre una corretta gestione del rischio e fai trading responsabilmente.
FEEDBACK E MIGLIORAMENTI
Se hai suggerimenti, richieste di funzionalità o idee per miglioramenti, lascia un commento nella scheda Discussione. Il tuo feedback aiuta a migliorare l'indicatore per tutti.
Riepilogo
Key features include dynamic color coding with lime indicating uptrends and red indicating downtrends, offering instant visual confirmation of trend direction through a noise-free, two-color design. Users can fine-tune the indicator’s responsiveness and smoothness via adjustable bandwidth and select a flexible lookback window ranging from 50 to 2000 bars to suit various timeframes and market conditions.
The indicator emphasizes mathematical precision and visual simplicity, requiring no complex settings. It is designed for traders seeking an adaptive smoothing method for trend identification without arbitrary period selection. This tool supports scalping strategies and is part of a broader suite of market analysis indicators focused on regression, volume, volatility, and custom timeframes.
Recensioni dei clienti
5 | 100 % | |
4 | 0 % | |
3 | 0 % | |
2 | 0 % | |
1 | 0 % |