Descrizione
NOTE IMPORTANTI - LEGGERE PRIMA
Il volume Forex non è volume reale
Il volume nel forex è volume tick — conta quante volte il prezzo cambia. NON conta quanti soldi sono stati scambiati.
Cosa il volume tick non può mostrare
- Dimensione della transazione. Una transazione da $100 e una da $10.000.000 contano entrambe come 1 tick.
- Flusso di denaro reale. Non puoi vedere se il prezzo è stato mosso da grandi o piccoli capitali.
- Vera liquidità. Non puoi vedere quante ordini sono in attesa nel mercato.
- Attività bancaria. Le banche vedono dati di volume reale. Tu no.
Cosa significa questo
Il volume tick mostra solo quanto spesso il prezzo è cambiato — non i soldi dietro. Questo crea problemi:
- Non puoi tracciare banche o istituzioni. Usano dati di volume reale a cui non hai accesso.
- Non puoi dimostrare teorie del "denaro intelligente". Queste idee richiedono volume reale, non conteggi tick.
- Non puoi giudicare la vera liquidità. L'attività tick non mostra la profondità degli ordini o la reale forza del mercato.
- Non puoi misurare il vero potere di acquisto o vendita. Molte piccole transazioni sembrano uguali a una grande transazione istituzionale.
- I picchi di volume possono ingannare. Un picco potrebbe essere solo rumore algoritmico, non reale interesse di trading.
Come usare correttamente questo indicatore
- Consideralo come un misuratore di attività, non di denaro. Alto volume tick = mercato attivo. Basso volume tick = mercato tranquillo. Nient'altro.
- Confronta l'attività tra diversi momenti. Usalo per vedere: la sessione di Londra è più attiva di New York? Oggi è più attivo di ieri? Il periodo di trend è più attivo della consolidazione?
- Combinalo con la struttura del prezzo. Usa supporti/resistenze, punti di swing o BOS/ChoCH insieme al volume. Il contesto del prezzo previene falsi segnali da picchi di volume rumorosi.
- Osserva l'attività a livelli di prezzo importanti. Quando il prezzo testa un livello chiave e il volume tick aumenta, significa che più trader sono attivi. NON significa che grandi operatori siano coinvolti.
- Non presumere che mostri attività istituzionale. Il volume tick non può mostrare accumulazione, grandi ordini o "denaro intelligente". Usalo solo per misurare ritmo e tempo.
__________________________________________________________________________________________
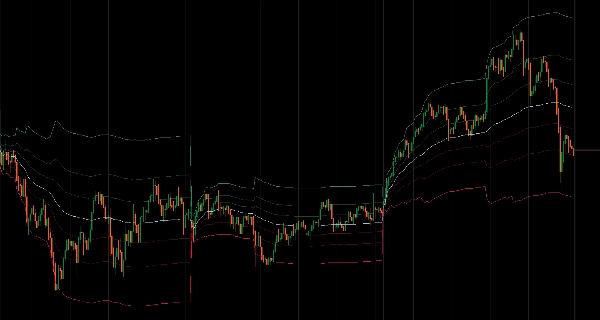
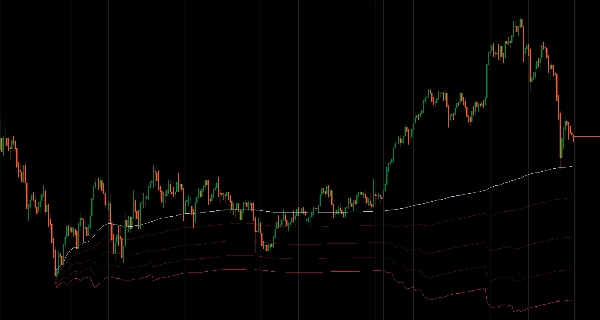
Prezzo Medio Ponderato per il Volume con periodi di reset flessibili e tre metodi di calcolo delle bande.
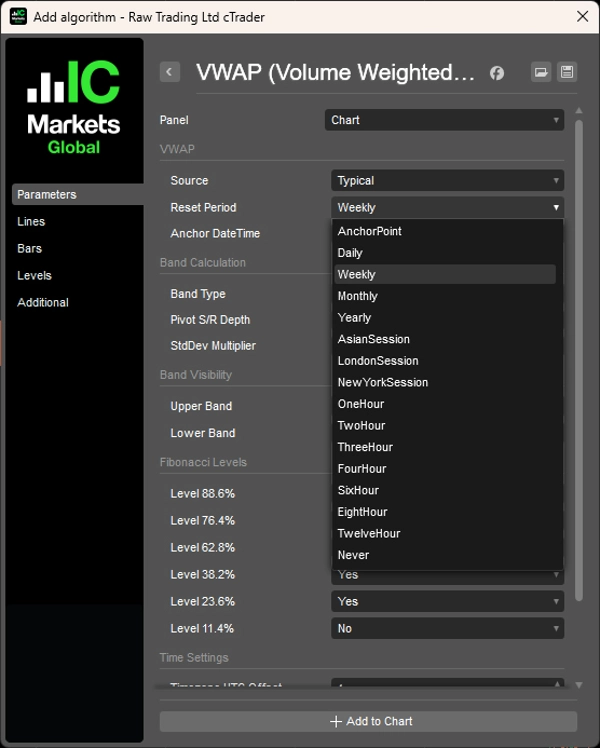
Calcola il Prezzo Medio Ponderato per il Volume con periodi di reset flessibili inclusi intervalli basati sul tempo (giornalieri, settimanali, mensili, annuali o orari personalizzati), reset basati sulla sessione (Asiatica, Londra, New York con orari di inizio configurabili), modalità punto di ancoraggio per fissare il VWAP a eventi specifici, o calcolo continuo da tutti i dati disponibili.
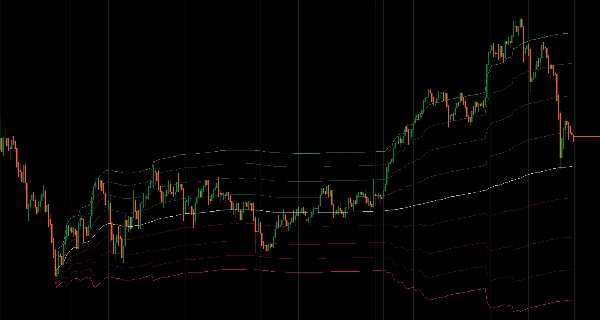
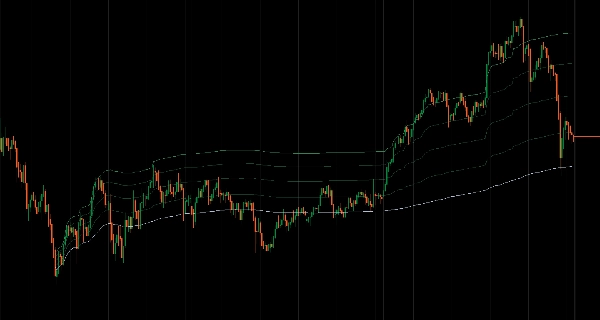
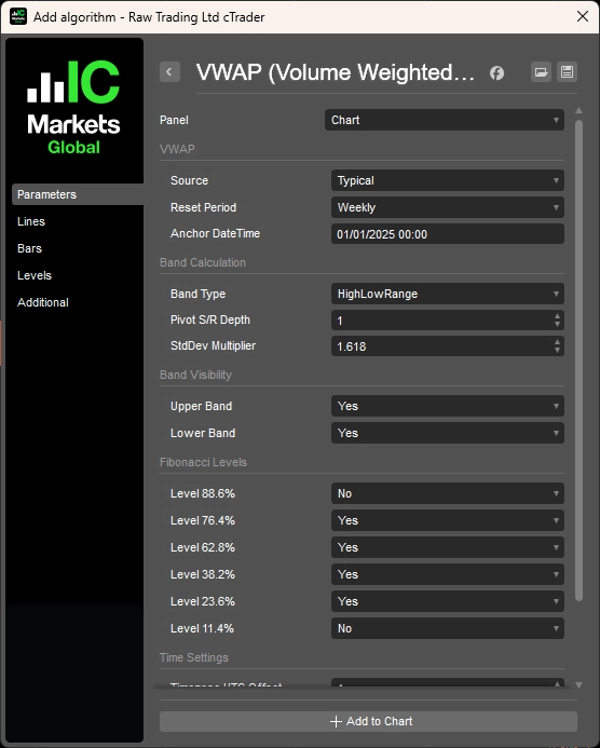
Offre tre metodi di calcolo delle bande: intervallo High/Low basato sull'intervallo di prezzo del periodo precedente, Pivot di Fibonacci usando calcoli classici di pivot, e bande di deviazione standard che si espandono e contraggono con la volatilità.
Puoi personalizzare otto livelli di Fibonacci (100%, 88,6%, 76,4%, 62,8%, 50%, 38,2%, 23,6%, 11,4%, 0%) con singoli toggle di visibilità e controlli rapidi per gruppi di bande superiori/inferiori. La gestione della sessione include configurazione esatta dell'orario di inizio con aggiustamento offset UTC e gestione del reset orario consapevole del fuso orario.
CARATTERISTICHE
- Periodi di Reset Flessibili
-
- Basati sul tempo: intervalli giornalieri, settimanali, mensili, annuali o orari personalizzati (1H, 2H, 3H, 4H, 6H, 8H, 12H)
- Basati sulla sessione: sessioni Asiatica, Londra, New York con orari di inizio configurabili e offset di fuso orario
- Punto di Ancoraggio: fissa il VWAP a qualsiasi data/ora specifica per analisi basate su eventi
- Continuo: calcola da tutti i dati disponibili senza reset
- Tre Metodi di Calcolo delle Bande
-
- Intervallo High/Low: bande basate sull'intervallo di prezzo del periodo precedente
- Pivot di Fibonacci: calcolo classico del punto pivot da H/L/C del periodo precedente
- Deviazione Standard: bande statistiche tradizionali che si espandono/contraggono con la volatilità
- Controllo Completo dei Livelli di Fibonacci
-
- 8 livelli personalizzabili: 100%, 88,6%, 76,4%, 62,8%, 50% (VWAP), 38,2%, 23,6%, 11,4%, 0%
- Toggle di visibilità individuale per ogni livello
- Controlli di gruppo per bande superiori/inferiori per regolazioni rapide
- Gestione della Sessione
-
- Configura orari esatti di inizio sessione con aggiustamento offset UTC (-12 a +14 ore)
- Visualizzazione delle informazioni sulla sessione mostra il programma di reset corrente
- Gestione del reset orario consapevole del fuso orario
- Ottimizzato per le Prestazioni
-
- Calcolo pigro—le bande vengono calcolate solo quando visibili
- Caching intelligente e elaborazione a batch
- Impatto minimo sulla CPU anche con tutti i livelli abilitati
__________________________________________________________________________________________
ALTRI INDICATORI GRATUITI
Esplora una vasta gamma di strumenti di analisi di mercato—dalla struttura e volume alla regressione, volatilità e timeframe personalizzati.
Il codice sorgente è disponibile sul repository GitHub.
Tutti gratuiti da usare. Ma se vuoi offrire un supporto per un caffè, puoi farlo qui.
Supporto/Resistenza
Volume
- Profiler di Attività di Volume
- Analizzatore di Efficienza del Volume
- Analisi del Profilo di Volume
- Profilo di Volume - Aggiornato
- Analisi della Distribuzione del Volume
- VWAP (Prezzo Medio Ponderato per il Volume)
Medie Mobili
- Canale SSL
- Media Mobile Ancorata
- Media Mobile Scalata per Deviazione
- Attivatore Gann High Low
- Linea di Tendenza Istantanea
- Media Mobile Adattiva di Kaufman con Visione del Trend
- Canale Media Mobile
- Suite di Medie Mobili
- Media Mobile Canale Trend
Utility/Personalizzati
Basati su Regressione
Volatilità
Oscillatori
__________________________________________________________________________________________
DICHIARAZIONE DI NON RESPONSABILITÀ
Il trading comporta rischi. Questo indicatore è destinato solo all'analisi tecnica — applica sempre una corretta gestione del rischio e opera responsabilmente.
FEEDBACK E MIGLIORAMENTI
Se hai suggerimenti, richieste di funzionalità o idee per miglioramenti, lascia un commento nella scheda Discussione. Il tuo feedback aiuta a migliorare l'indicatore per tutti.
Riepilogo
The indicator offers three band calculation methods: High/Low Range bands based on the previous period's price range, Fibonacci Pivot bands using classical pivot calculations, and Standard Deviation bands that adjust with market volatility. Users can customize eight Fibonacci levels (ranging from 0% to 100%) with individual visibility toggles and group controls for upper and lower bands.
Session management features include precise start time configuration with UTC offset adjustments and timezone-aware hourly resets, along with visual session information display. Performance optimizations include lazy calculation of bands only when visible, intelligent caching, and batch processing to minimize CPU usage.
Note: For forex markets, volume data represents tick volume (price change counts) rather than actual traded volume, so this indicator should be used as a measure of market activity rather than real money flow. It is intended for technical analysis with proper risk management.
Recensioni dei clienti
5 | 100 % | |
4 | 0 % | |
3 | 0 % | |
2 | 0 % | |
1 | 0 % |


![Logo di "[CB] Pivot Points Pro"](https://cdn.ctrader.com/image/webp/43463c82-67b0-4f10-a4ba-901bba091d81_32594)