
Beschreibung
Erweiterte Version mit Steuerung der Schwelle für Teilfüllungen, präziser Altersverfolgung und automatischen Fibonacci-Niveaus bei Gaps.
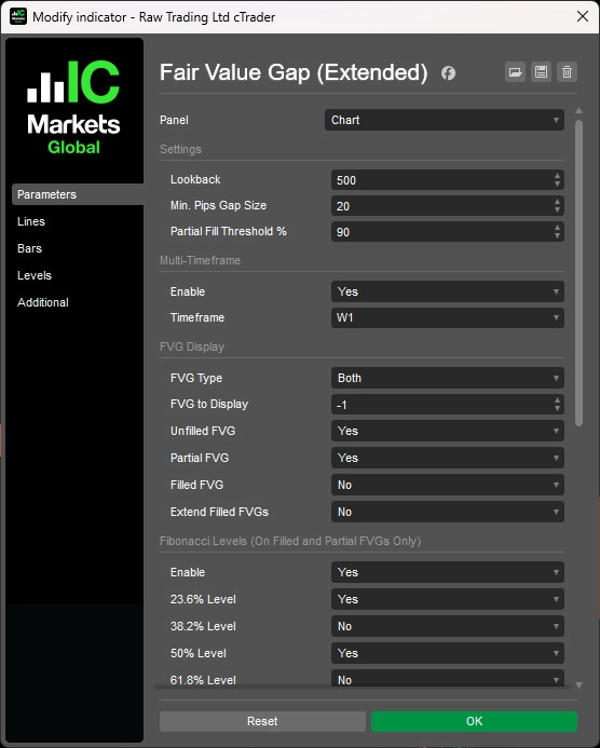
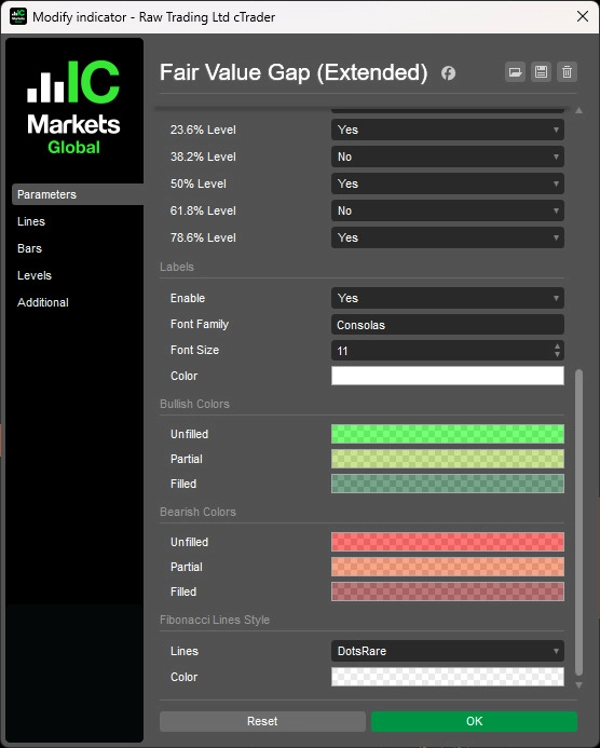
Erkennt automatisch bullische und bärische Gaps mit konfigurierbarer Schwelle für Teilfüllungen (50-99 %, Standard 90 %), zeigt das Gap-Alter im Format Jahre/Monate/Wochen/Tage an und projiziert fünf Fibonacci-Niveaus (23,6 % bis 78,6 %) auf teilweise und vollständig gefüllte FVGs.
Mehrzeitrahmen-Scan zur Ausrichtung von HTF-Struktur-Gaps mit LTF-Preisbewegungen, Option zur Verlängerung gefüllter FVG-Boxen bis zur aktuellen Kerze, unbegrenzte Anzeige historischer Gaps (-1 Einstellung), dynamische Statusaktualisierungen (ungefüllt/teilweise gefüllt/vollständig gefüllt) und minimale, unaufdringliche Beschriftungen bieten eine umfassende Analyse von Liquiditätsungleichgewichten für Trader, die Gap-Füllungen mit Fibonacci-basierten Einstiegszonen anstreben.
FUNKTIONEN
Verbesserte FVG-Erkennung
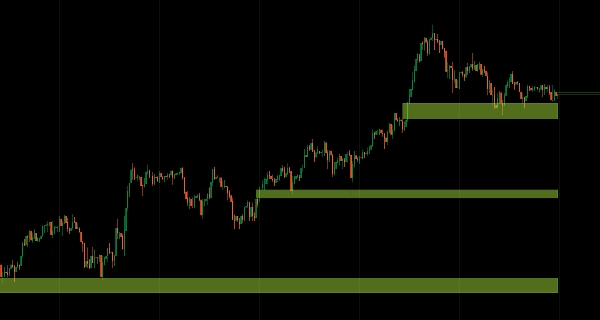
- Findet automatisch bullische und bärische Fair Value Gaps
- Verfolgt den Status ungefüllt, teilweise gefüllt und vollständig gefüllt in Echtzeit
- Schwelle für Teilfüllung: Steuerung, wann Teilfüllung zur Vollfüllung wird (50-99 %, Standard 90 %)
- Saubere visuelle Darstellung mit minimaler Chart-Unordnung
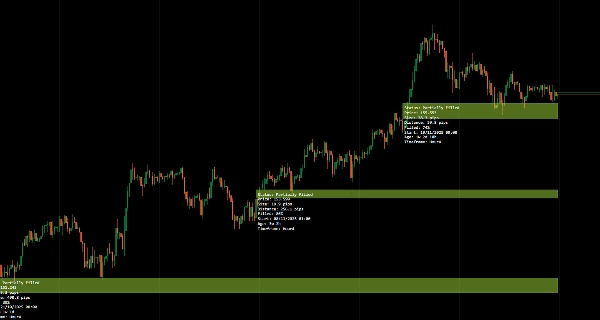
Verbesserte Altersanzeige
- Zeigt präzises Gap-Alter im Format Jahre, Monate, Wochen und Tage an (z. B. „3j 2w 4d“)
- Hilft bei der Priorisierung frischer gegenüber veralteten Gaps für die Handelsauswahl
- Zeitlicher Kontext verbessert die Entscheidungsfindung zur Relevanz von Gaps
Statusverfolgung & Anzeige
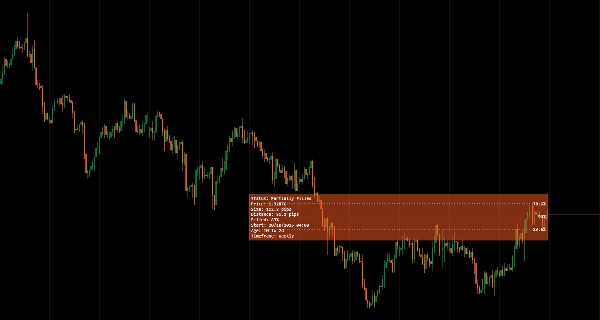
- Zeigt aktuellen Füllstatus: ungefüllt, teilweise gefüllt oder vollständig gefüllt
- Aktualisiert sich dynamisch, wenn der Preis mit dem Gap interagiert
- Visuelle Bestätigung der Liquiditätserfassung
- Gefüllte FVGs verlängern: Option, gefüllte FVG-Boxen bis zur aktuellen Kerze zur Referenz zu verlängern
Fibonacci-Niveaus
- Automatische Fibonacci-Niveaus (23,6 %, 38,2 %, 50 %, 61,8 %, 78,6 %) werden auf teilweise und vollständig gefüllten FVGs angezeigt
- Erspart das manuelle Zeichnen von Niveaus
- Präzise Einstiegszonen innerhalb der Gaps
- Fibonacci-basierte Einstiegsstrategien einfach gemacht
Multi-Timeframe-Modus
- Scannt und zeigt FVGs höherer Zeitrahmen in Charts niedrigerer Zeitrahmen an
- Richtet HTF-Struktur-Gaps mit LTF-Preisbewegungen aus
- Verbessert den Analyse-Workflow über mehrere Zeitrahmen
Alle FVGs anzeigen
- Setzen Sie „FVG to Display“ auf -1, um alle historischen FVGs ohne Limit anzuzeigen
- Vollständige Sichtbarkeit des Gap-Verhaltens in Ihrem Chart
- Verfolgen Sie Gap-Füllmuster im Zeitverlauf
Saubere, minimale Benutzeroberfläche
- Unaufdringliche Beschriftungen für Klarheit gestaltet
- Informativ, ohne Ihre Preisansicht zu überladen
- Professionelle Präsentation für fokussierte Analyse
__________________________________________________________________________________________
MEHR KOSTENLOSE INDIKATOREN
Entdecken Sie eine breite Palette von Marktanalysetools – von Struktur und Volumen bis hin zu Regression, Volatilität und benutzerdefinierten Zeitrahmen.
Der Quellcode ist auf GitHub Repository verfügbar.
Alle kostenlos nutzbar. Wenn Sie jedoch Kaffee-Unterstützung senden möchten, können Sie dies hier tun.
Support/Widerstand
Volumen
- Volume Activity Profiler
- Volume Efficiency Analyzer
- Volume Profile Analytics
- Volume Profile – Aktualisiert
- Volume Spread Analysis
- VWAP (Volumen-gewichteter Durchschnittspreis)
Gleitende Durchschnitte
- SSL-Kanal
- Verankerter gleitender Durchschnitt
- Abweichungsskaliertes gleitendes Mittel
- Gann High Low Aktivator
- Instantane Trendlinie
- Kaufman Adaptive MA mit Trend Vision
- Gleitender Durchschnittskanal
- Gleitende Durchschnitte Suite
- Trendkanal gleitender Durchschnitt
Dienstprogramme/Benutzerdefiniert
Regressionsbasiert
Volatilität
Oszillatoren
__________________________________________________________________________________________
HAFTUNGSAUSSCHLUSS
Der Handel ist mit Risiken verbunden. Dieser Indikator dient ausschließlich der technischen Analyse – wenden Sie stets ein angemessenes Risikomanagement an und handeln Sie verantwortungsbewusst.
FEEDBACK & VERBESSERUNGEN
Wenn Sie Vorschläge, Funktionswünsche oder Ideen zur Verbesserung haben, hinterlassen Sie bitte einen Kommentar im Diskussions-Tab. Ihr Feedback hilft, den Indikator für alle zu verbessern.
Zusammenfassung
The indicator displays the precise age of each gap in years, months, weeks, and days, aiding traders in prioritizing fresh versus stale gaps. It projects five Fibonacci retracement levels (23.6%, 38.2%, 50%, 61.8%, 78.6%) on partial and filled gaps, providing predefined entry zones based on Fibonacci ratios without manual drawing.
Fair Value Gap (Extended) supports multi-timeframe analysis by scanning higher timeframe gaps and displaying them on lower timeframe charts, facilitating alignment of structural gaps with price action. It offers options to extend filled gap boxes to the current bar and to display unlimited historical gaps for comprehensive gap behavior tracking.
The indicator features a clean, minimal user interface with non-intrusive labels, delivering clear liquidity imbalance insights for traders focusing on gap fills and Fibonacci-based entries.
Kundenbewertungen
5 | 100 % | |
4 | 0 % | |
3 | 0 % | |
2 | 0 % | |
1 | 0 % |


