Beschreibung
Drei-Farben-adaptives Kanalsystem mit gleitenden Durchschnitten für alle vier OHLC-Preise zur Trendrichtung und Strukturanalyse.
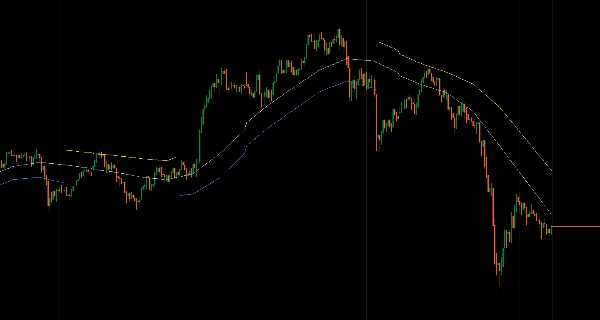
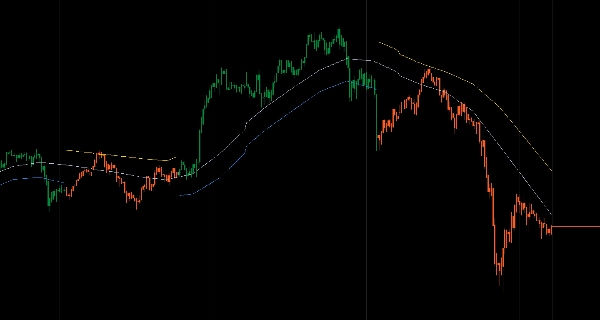
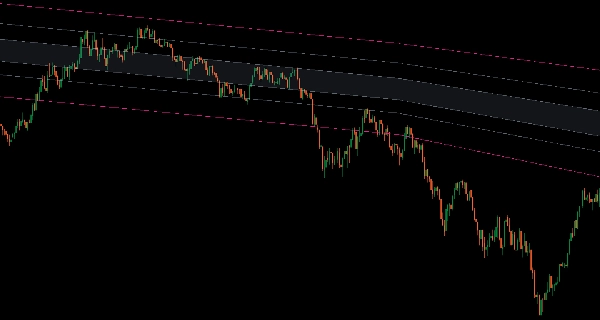
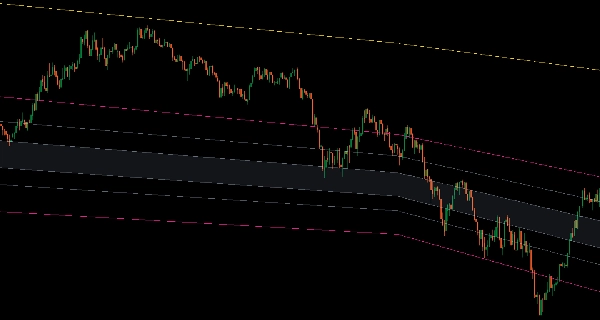
Zeigt Hoch-/Tief-Grenzen, Open/Close-Richtungslinien und Median-Gleichgewicht mit farbcodierten Trendzuständen (Blau Aufwärtstrend, Gold Abwärtstrend, Grau neutral), die sich gemeinsam anpassen.
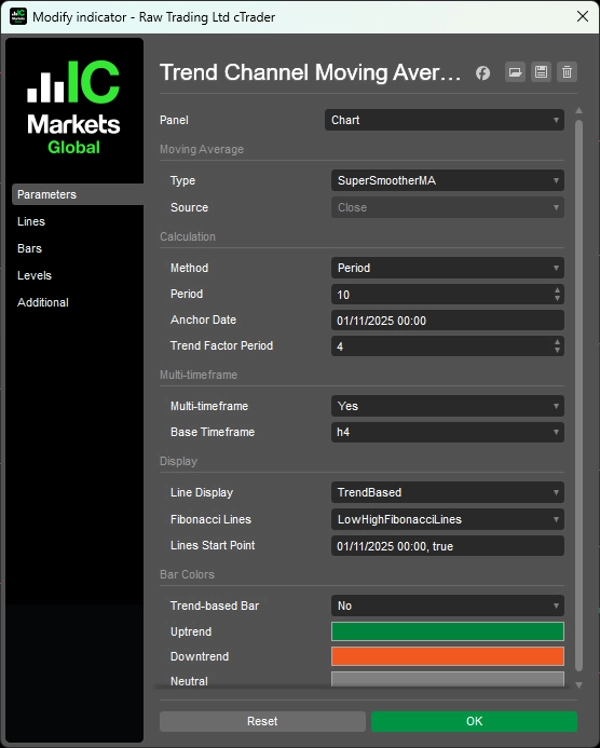
Zwei Anzeigemodi (voller Kanal oder trendbasierte Unordnungsminderung), sechs optionale Fibonacci-Zonen (vollständige Kanal-Retracements, Halbkanal-Level, Ausbruchs-Erweiterungen), 15 gleitende Durchschnittsalgorithmen (Arnaud Legoux, Jurik, Hull, KAMA, VIDYA, Deviation Scaled, SuperSmoother, Ultimate Smoother, McGinley Dynamic, T3, ZLEMA, Laguerre), Multi-Timeframe-Interpolation, Ankerdatum-Berechnung für ereignisbasierte Wachstumsperioden und trendbasierte Balkenfärbung liefern eine kohärente Kanalstruktur für Trader, die Rücksetzer und Mittelwertumkehr innerhalb definierter Grenzen anstreben.
EIGENSCHAFTEN
Drei-Farben-Trendsystem
- Blaue Linien: Aufwärtstrend bestätigt – Rücksetzer zur unteren Linie handeln
- Goldene Linien: Abwärtstrend bestätigt – Abpraller zur oberen Linie handeln
- Graue Linien: Neutral/Seitwärts – Extreme ausblenden, Mitte scalpieren
- Alle Linien passen sich gemeinsam an – keine gemischten Signale
Vollständige Kanalstruktur
- Hoch-/Tief-Linien definieren Kanalgrenzen
- Open/Close-Linien zeigen Richtungsbias innerhalb des Kanals
- Medianlinie (Mitte aller vier) markiert das wahre Gleichgewicht
- Integrierte Struktur, die sich kohärent bewegt
Zwei Anzeigemodi
- Kanalmodus: Zeigt immer beide Grenzen mit Trendfarben
- Trendbasierter Modus: Verbirgt obere Linie bei Aufwärtstrends, untere Linie bei Abwärtstrends – reduziert visuelles Durcheinander, hält Fokus auf handelbarer Grenze
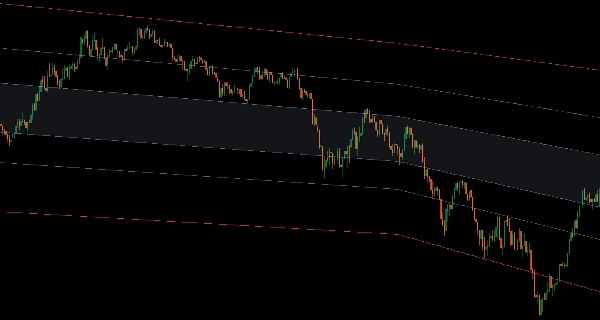
6 Fibonacci-Zonen (optional)
- Zwischen Tief-Hoch (vollständige Kanal-Retracements)
- Zwischen Tief-Median oder Median-Hoch (Halbkanal-Level)
- Obere/untere Erweiterungen (Ausbruchsziele)
- Gesamtrange (von unterer bis oberer Erweiterung)
15 Arten von gleitenden Durchschnitten
- Professionelle Algorithmen: Arnaud Legoux, Jurik, Hull, KAMA, VIDYA, Deviation Scaled, SuperSmoother, Ultimate Smoother, McGinley Dynamic, T3, ZLEMA, Laguerre
- Saubere Signale, optimiert für Trendidentifikation
Erweiterte Funktionalität
- Multi-Timeframe-Modus mit sanfter Interpolation
- Ankerdatum-Berechnung (Wachstumsperiode ab spezifischem Ereignis/Level)
- Trendbasierte Balkenfärbung (optional)
- Startpunkt-Kontrolle der Linien (historische Daten ausblenden, nur aktuelle Struktur anzeigen)
__________________________________________________________________________________________
MEHR KOSTENLOSE INDIKATOREN
Entdecken Sie eine breite Palette von Marktanalysetools – von Struktur und Volumen bis Regression, Volatilität und benutzerdefinierten Zeitrahmen.
Quellcode ist auf GitHub Repository verfügbar.
Alle kostenlos nutzbar. Aber wenn Sie Lust haben, eine Kaffee-Unterstützung zu senden, können Sie diese hierhinleiten.
Support/Widerstand
Volumen
- Volume Activity Profiler
- Volume Efficiency Analyzer
- Volume Profile Analytics
- Volume Profile - Aktualisiert
- Volume Spread Analysis
- VWAP (Volumen-gewichteter Durchschnittspreis)
Gleitende Durchschnitte
- SSL-Kanal
- Anker-Gleitender Durchschnitt
- Deviation-Scaled Gleitender Durchschnitt
- Gann High Low Aktivator
- Instantane Trendlinie
- Kaufman Adaptive MA mit Trend Vision
- Gleitender Durchschnittskanal
- Gleitende Durchschnitts-Suite
- Trendkanal-Gleitender Durchschnitt
Dienstprogramme/Benutzerdefiniert
Regressionsbasiert
Volatilität
Oszillatoren
__________________________________________________________________________________________
HAFTUNGSAUSSCHLUSS
Trading beinhaltet Risiken. Dieser Indikator ist nur für die technische Analyse gedacht – wenden Sie stets ein angemessenes Risikomanagement an und handeln Sie verantwortungsbewusst.
FEEDBACK & VERBESSERUNGEN
Wenn Sie Vorschläge, Funktionswünsche oder Ideen zur Verbesserung haben, hinterlassen Sie bitte einen Kommentar im Diskussions-Tab. Ihr Feedback hilft, den Indikator für alle zu verbessern.
Zusammenfassung
Key features include two display modes—full channel and trend-based clutter reduction—and six optional Fibonacci zones covering full and half-channel retracements plus breakout extensions. The system supports 15 professional moving average algorithms such as Arnaud Legoux, Jurik, Hull, KAMA, VIDYA, and others, optimized for clean trend identification. Additional functionalities include multi-timeframe interpolation, anchor date calculation for event-based periods, trend-based bar coloring, and control over line start points to focus on recent data.
This indicator is designed to help traders identify pullbacks and mean reversion opportunities within defined channel boundaries, enhancing decision-making in various market conditions.
Kundenbewertungen
5 | 100 % | |
4 | 0 % | |
3 | 0 % | |
2 | 0 % | |
1 | 0 % |