Beschreibung
▁▂▃▄▅▆▇ █ 10.000+ Händler (institutionell + privat) █ ▇▆▅▄▃▂▁
- Wählen Sie unsere TOP-Indikatoren in cTrader 🏆
- ✨ Exklusive Präzision für überlegene Ergebnisse ✨
- 📈 Unsere Algorithmen — mit den bestbewerteten Visualisierungen 🎯—
- wurden erfolgreich in 2 quantitativen Fonds implementiert
▁▂▃▄▅▆▇ █████████████████████████████ ▇▆▅▄▃▂▁
_______________________________________________
_______________________________________________
📌 Marktstruktur-Indikatoren
· ✅ AdvancedMarket Structure: Bos, Choch, SwinLevels, Order Blocks, Marktstruktur& Liquidity Finder
· 🔄 Dynamische Marktstrukturanalyse von Wendepunkten
· 🧱 Order Block
· ⚖️ Marktungleichgewicht
· ⛓️ BOS & CHOCH
· 🧠 ICT Power of 3
______________________________________________________________-
Store cBots : 🧠 Gold & BTC BreakoutSession Pivots 🧠
_______________________________________________
🔚 Intelligente Ausstiegssysteme
· 📍 Trailing Smart Algorithmus
_______________________________________________
📐 ZigZag-Indikatoren
· 🔍 ZigZag Preis-Liquiditätsprojektion
· ➖ ZigZag
_______________________________________________
🧱 Support- & Resistance-Indikatoren
· 🟩 SmartTrend Support- & Resistance-Linien
· 🧱 Alle Support- und Resistance-Level
_______________________________________________
📊 Trend- & Kanalindikatoren
· 🔄 Auto-Trend-Kanal
· 📊 Supertrend
· 🔁 Reaktive gleitende Durchschnittslinie
_______________________________________________
💧 Volumen- & Liquiditätswerkzeuge
_______________________________________________
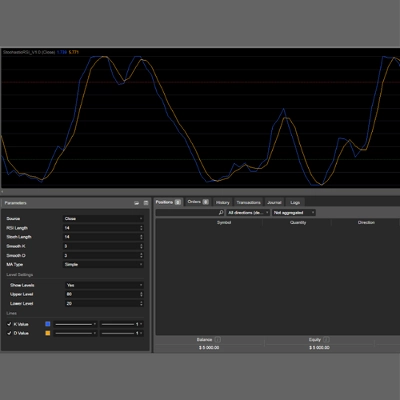
⚡ Momentum- & RSI-Indikatoren
· 🚀 Dynamisches Range-Momentum
· 🔎 Multi-Level Candle Bias Tracker
_______________________________________________
🔮 Prognose- & Projektionswerkzeuge
· 📐 Prognose basierend auf Linreg & ATR
· 📏 Fibonacci Lineare Regression Multi-Timeframe
· 📈 Volumengetriebener Marktfluss-Projektor
______________________________________________________________________________________________________
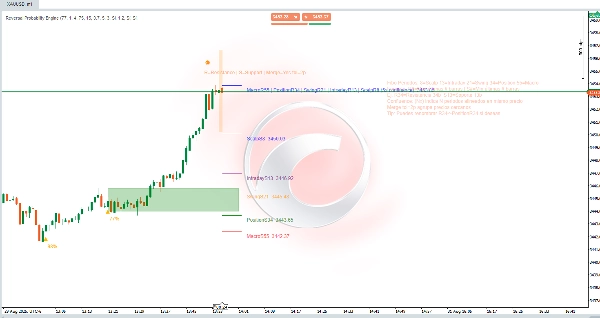
UMKEHRWAHRSCHEINLICHKEITS-ENGINE 🔄
Ein hybrider Indikator zur Erkennung von Umkehrzonen + multidimensionale Kartierung von Unterstützungs- und Widerstandsniveaus "Goldene Levels". Er kombiniert Strukturanalyse (Fibonacci-Fenster Hochs/Tiefs), Dynamik (Preisgeschwindigkeit und Beschleunigung), Entropie/Chaos (Ordnung vs. Unordnung), Momentum und Volumen, um zu erzeugen:
- Hierarchische Unterstützungs-/Widerstandsebenen nach Zeithorizont.
- Wahrscheinlichkeitsbasierte Signale potenzieller Umkehrungen (Höhen und Tiefen) mit % Vertrauen. ⚠️
- Aktive Zonen (Rechteck) zur Kontextualisierung von Trades und Stops.
- Konfluenz-Cluster (wenn mehrere Zeitrahmen am gleichen Preis zusammenfallen). 🎯
2. Ziel
Reduzierung visueller Störungen und Erleichterung der Entscheidungsfindung durch Identifikation von:
- Wo der Preis über verschiedene Horizonte komprimiert oder verankert wurde.
- Wo die statistische Wahrscheinlichkeit einer Umkehr steigt (bestätigt oder erwartet). 📊
- Welche Niveaus das größte "Gewicht" haben (Konfluenz).
3. Konzeptuelle Logik
a) Niveaus: Für jedes Fibonacci-Fenster werden das jüngste Hoch (R) und Tief (S) genommen; dies bietet eine fraktale Skala von Kontexten (ultrakurz bis makro).
b) Fusion: Wenn mehrere verschiedene Niveaus innerhalb von X Pips liegen, werden sie gruppiert → ein Cluster mit kombiniertem Label und Konfluenzanzahl.
c) Umkehrsignale: Gesucht werden lokale Erschöpfungsmuster (Wellenform), Verzögerung (Steigungsänderung), niedriger Entropieabfall (niedrige Entropie = stärker richtungsgebundene Bewegung, die zur Umkehr neigt), mögliche interne Divergenzen sowie Momentum-/Volumenbestätigungen.
d) Prädiktiver Modus: Ermöglicht die Vorwegnahme von Umkehrungen (Diamant) vor vollständiger Bestätigung, wenn gegensätzliche Beschleunigung + niedrige Entropie + extremer Zustand zusammenfallen. 💎
e) Wahrscheinlichkeit: Normalisierte Gewichtung verschiedener Faktoren (Trend, Chaos, Momentum, Volumen, Divergenz, Anpassung). Abgeschnittenes Ergebnis 40–99%.
f) Aktive Zone: Nach einem Signal wird der logischste Bereich (zwischen relevanten Niveaus) gesucht, um den Trade zu verwalten und Stops zu kontextualisieren.
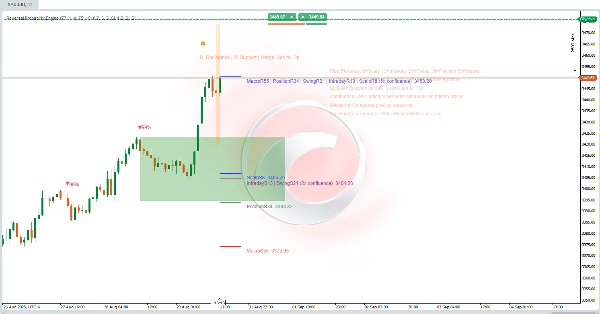
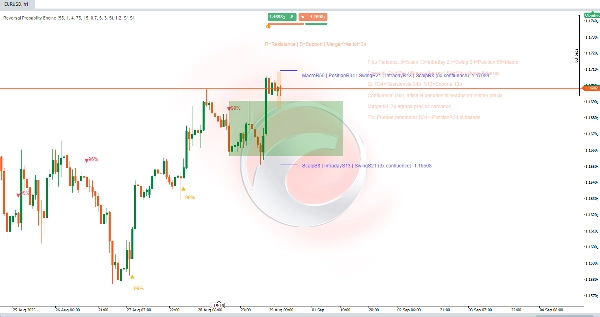
4. Visuelle Komponenten
- Horizontale Linien: Niveaus nach Zeitraum (Scalp 8, Intraday 13, Swing 21, Position 34, Makro 55). Einheitliche Farbe pro Horizont.
- R#/S# Labels: R = Widerstand (jüngstes Hoch dieses Fensters), S = Unterstützung (jüngstes Tief). Z.B.: R34 = Widerstand abgeleitet von den letzten 34 Kerzen.
- Zusammengeführte Labels:
ScalpS8 | IntradayS13 | … (5x Konfluenz) Preis. Zeigt an, dass N verschiedene Zeiträume dasselbe Niveau (oder innerhalb der Toleranz) ergeben. Je mehr, desto relevanter. ✅ - (Nx Konfluenz): Anzahl der übereinstimmenden Zeiträume.
- Merge tol=Xp: Toleranz in Pips, die nahegelegene Niveaus gruppiert (vermeidet Überfüllung).
- Wahrscheinlichkeiten (%): Text über/unter Dreiecken (Runter / Hoch) oder Diamant (Früherkennung).
- Grünes Rechteck (aktive Zone): Dynamischer Operationskanal, in dem die Entwicklung nach dem Signal bewertet wird.
- Zusätzliche subtile Blöcke/Farben: Unterstützungselemente (Wellen/Partikel), falls aktiviert.
5. Praktische Interpretation
- Hohe Konfluenz (≥3x) = starker "Magnet" oder Pivot-Level; auf Preisreaktion achten. 🧲
- Signal + nahe Konfluenz verstärkt die Gültigkeit (garantiert sie aber nicht).
- Wahrscheinlichkeit ≥ Mindestvertrauens-%: Minimaler Filter zur Berücksichtigung der Aktion.
- Unterscheidung Erwartet (Diamant) vs. Bestätigt (Dreieck): Das Erwartete bietet besseres Risiko/Ertrag, höhere Falschraten; das Bestätigte kommt mit weniger Asymmetrie, aber mehr Validierung.
- Rechteck: Bleibt der Preis darin und verletzt nicht die gegenüberliegende Kante, bleibt die These bestehen; ein klarer Bruch reduziert die Erwartung.
- MergeTolerance vergrößern oder verkleinern: Kleiner = größere Granularität, Größer = stärker synthetisierte Cluster.
6. Anwendungsablauf
- Laden Sie den Indikator auf das gewünschte Instrument und den Zeitrahmen.
- Passen Sie den Mindestvertrauens-% entsprechend der Toleranz an (z.B. niedriger für Scalping, höher für Swing).
- Prüfen Sie, ob ein Cluster aus mehreren Unterstützungs-/Widerstandsniveaus erscheint (5x, 4x, etc.).
- Warten Sie auf ein Signal (ideal, wenn es am Rand des Clusters und mit hoher Wahrscheinlichkeit auftritt). 🔔
- Begrenzen Sie das Management innerhalb der aktiven Zone: gestaffelter Einstieg oder Bestätigung eines gescheiterten Ausbruchs.
- Definieren Sie einen logischen Stop: jenseits des ersten niedrigeren (bei Long) oder höheren (bei Short) Niveaus, das nicht in der Konfluenz enthalten ist.
- Deaktivieren Sie Zeiträume, die Sie nicht verwenden (z.B. nur Swing/Makro für Long-Positionen).
- Passen Sie die Toleranz an und blenden Sie optional das Erklärpanel aus, sobald Sie es gelernt haben.
7. Beispiel für schnelles Label-Lesen
ScalpS8 | IntradayS13 | SwingS21 | PositionS34 | MacroS55 (5x Konfluenz)
Bedeutung: Alle Zeitrahmen (8–55) teilen sich denselben Boden → mehrskalige strukturelle Unterstützung. Höhere Wahrscheinlichkeit einer Reaktion; wenn mit Volumen verloren, impliziert dies eine ernsthaftere Regimeänderung. 🚨
Zusammenfassung
Key features include:
- Hierarchical support and resistance levels categorized by time horizons (from ultra-short scalp to macro scales).
- Probabilistic reversal signals indicating potential peaks and valleys with confidence percentages.
- Active zones displayed as rectangles to help contextualize trade entries and stop placements.
- Confluence clusters that highlight price levels confirmed across multiple timeframes, enhancing level significance.
The indicator reduces visual noise by grouping nearby levels within a tolerance range and provides clear visual components such as horizontal lines, labeled resistance/support points, merged confluence labels, probability percentages, and active zones. It distinguishes between anticipated and confirmed reversal signals, offering traders options for risk management and trade timing.
Users can adjust confidence thresholds and merge tolerances to tailor granularity and filtering according to their trading style and timeframe. The tool supports structured decision-making by identifying statistically significant reversal areas and multi-scale support/resistance clusters on any instrument and timeframe.
Kundenbewertungen
5 | 0 % | |
4 | 0 % | |
3 | 0 % | |
2 | 0 % | |
1 | 100 % |