present
Sign up and get $50 off your first purchase
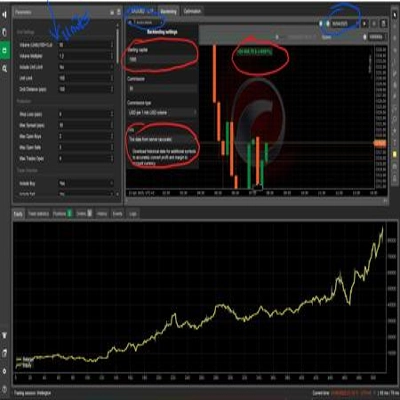
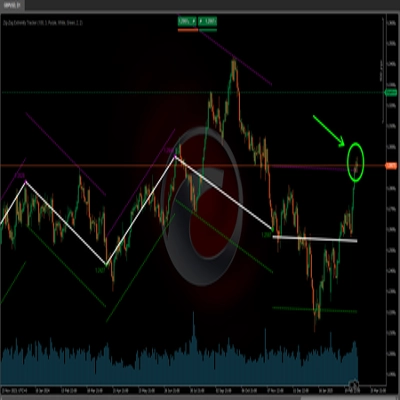
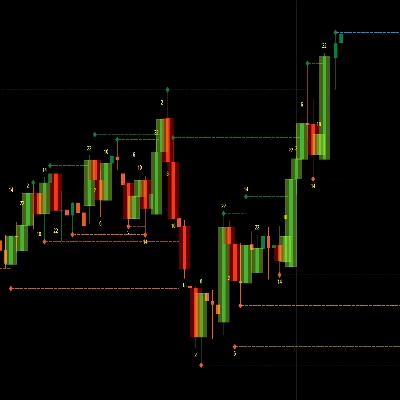
Trading product for ZIG ZAG Indicator Premium/Discount  Head and Shoulders, image 1
ZIG ZAG
Indicator
Version 1.0, May 2026
Windows, Mac
4.4
Reviews: 5
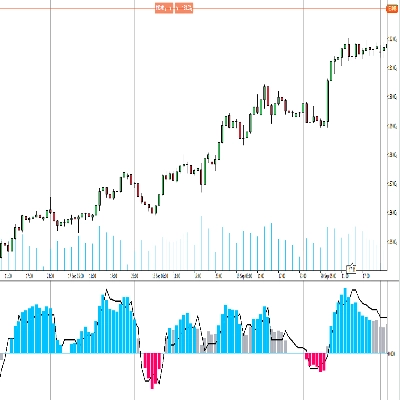
Trading product for ZIG ZAG Indicator Premium/Discount  Head and Shoulders, image 2
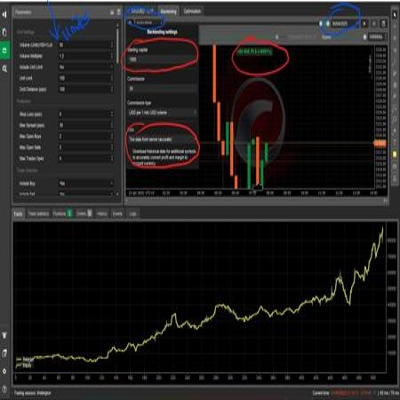
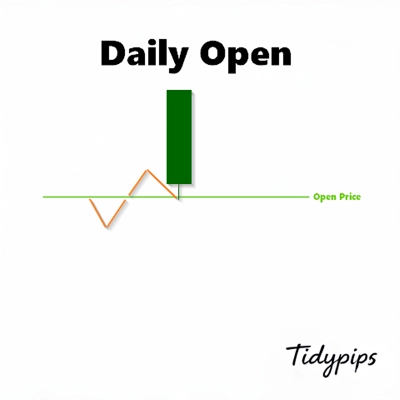
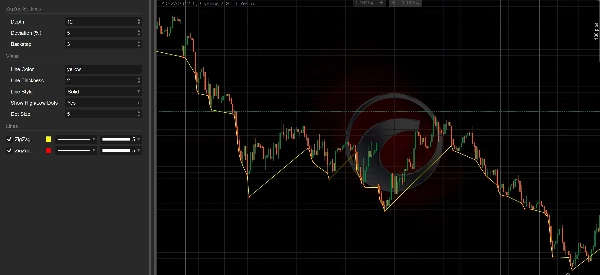
Trading product for ZIG ZAG Indicator Premium/Discount  Head and Shoulders, image 3
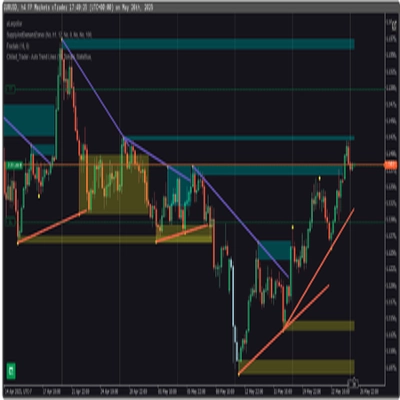
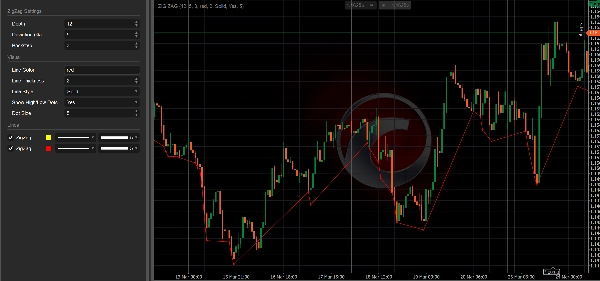
Trading product for ZIG ZAG Indicator Premium/Discount  Head and Shoulders, image 4
82.74M
Traded volume
50.16K
Pips won
6
Sales
445
Free installs

Description

ZigZag Indicator

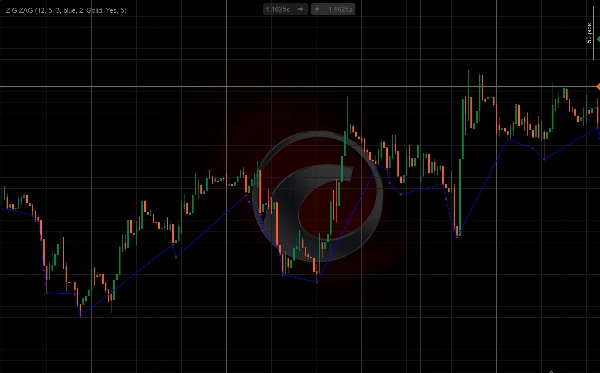
This Customizable ZigZag indicator filters out minor price noise and connects only the most significant swing highs and lows with a series of lines, giving traders a clean visual map of market structure and key turning points.

It works by scanning a rolling window of bars (Depth) to identify meaningful pivots, only confirming a swing when the move from the previous opposite point exceeds a minimum Deviation percentage. The Backstep setting ensures two pivots of the same type aren't registered too close together, keeping the output clean and relevant.

Visually, the connecting lines reveal trend structure at a glance — rising lines indicate higher highs and higher lows; falling lines indicate lower highs and lower lows. Optional dots mark each confirmed pivot precisely, useful as support, resistance, and pattern reference points.

Key parameters — Depth, Deviation, and Backstep — control how sensitive the indicator is. Higher values produce fewer, larger swings suited to higher timeframe analysis; lower values capture more frequent pivots for shorter-term work. Line colour, thickness, and style are fully customizable.

Traders can use this indicator for: trend structure analysis, support and resistance mapping, chart pattern recognition (double tops/bottoms, head and shoulders), and anchoring Fibonacci retracements to confirmed swing points.

It can be used on any trading pair.

Summary

AI summary
The Zig Zag indicator is a customizable technical analysis tool designed to filter out minor price fluctuations and highlight significant swing highs and lows on a price chart. It operates by scanning a rolling window of bars (Depth) to identify meaningful pivot points, confirming swings only when price moves exceed a specified minimum Deviation percentage. The Backstep parameter prevents registering pivots of the same type too close together, ensuring clarity.

Visually, the indicator connects these pivots with lines that reveal market trend structure: rising lines indicate higher highs and lows, while falling lines show lower highs and lows. Optional dots mark confirmed pivots, which can serve as reference points for support, resistance, and chart pattern recognition.

Key adjustable settings—Depth, Deviation, and Backstep—allow users to tailor sensitivity for different timeframes, from capturing large swings on higher timeframes to more frequent pivots on shorter-term charts. Line color, thickness, and style are fully customizable.

Traders use the Zig Zag indicator for analyzing trend structure, mapping support and resistance levels, identifying classical chart patterns such as head and shoulders, double tops/bottoms, and anchoring Fibonacci retracements to confirmed swing points. It is applicable to any trading pair and supports visualization and signal outputs for breakout and reversal events based on bar data.
Indicator profile
Indicator category
Trend
Output type
Visualisation
Signals
Data requirements
Bars only
Supported signals
Breakout
Reversal

Customer reviews

4.4
Reviews: 5
5
40 %
4
60 %
3
0 %
2
0 %
1
0 %
Customer reviews
May 31, 2026
May 30, 2026
May 23, 2026
it feels useful once the click feels less impulsive, and half size is enough at the start.
May 22, 2026
ZIG ZAG is a classic market structure indicator that helps simplify price action by filtering out minor noise and highlighting meaningful swing highs and lows. It works well for trend structure analysis, Fibonacci anchoring, and chart pattern recognition. Lightweight, flexible, and visually clean, it remains one of the most practical tools for discretionary technical analysis.
May 22, 2026
The first 10 trades should stay boring, and the trade idea gets slowed down first.

Discussion

FAQ

Premium/Discount
Head and Shoulders
Flag
Key Levels
Market Structure
Supply & Demand
Support & Resistance
Products available through cTrader Store, including trading bots, indicators and plugins, are provided by third-party developers and made available for informational and technical access purposes only. cTrader Store is not a broker and does not provide investment advice, personal recommendations or any guarantee of future performance.

More from this author

cBot
XAUUSD
Commodities
Need Trial Version of Rocket Drive? Get it here
Indicator
EMA
RSI
+5
MACD Colour Histogram with 11 Moving Average Types, Multi-timeframe confirmation and Sound Signal Alert.
Indicator
Market Structure
An indicator That tracks the four major forex sessions — Sydney, Tokyo, London, and New York, with DST
cBot
AI
XAUUSD
+1
An AI infused Self Gold Recalibration Robot that uses custom indicator with 4 Take Profit features to maximize profit.
Indicator
BOS
Key Levels
+2
Realtime Trade Adviser will tell you When to BUY and When to SELL. A real time Trade Prompter
Indicator
Inducement
Key Levels
+5
Digital Clock Overlay that displays a live, second-by-second clock and optional date directly on the trading chart.
Indicator
ATR
Fibonacci
+1
Trading Clock Pro: An all-in-one market timing dashboard designed to help traders understand the market at one Spot.

You may also like

Indicator
📊 Smart Floating Risk Pro – Advanced Risk Management for cTrader
Indicator
ATR
RSI
+16
Multi-timeframe trend indicator using EMA, MACD & ADX to confirm high-probability buy and sell bias.
Indicator
ADX
ATR
+1
Indicador de Sinais Visuais para Spotcrude (WTI) ou SpotBrent com filtros de tendência, operacional de 10 e 15 minutos.
Indicator
RSI
Breakout
+1
Dynamically adjusts regression channels based on ZigZag extremes, resetting when price breaks bands to track real trends
Indicator
Forex
BTCUSD
+11
Unlock trading precision with QQE! Dual QQE indicators with a Bollinger Bands zero line provide clear buy/sell signals.
Indicator
This indicator is a valuable tool for traders looking to identify significant opening price level of any asset.
Indicator
Forex
Crypto
+4
Auto Trend Line Indicator for cTrader
Indicator
Prop
Forex
+13
Decision System Indicator According to Cosmic Laws
Indicator
ATR
SMC
+21
MA Quant Adaptive Price Zone Oscillator identifie dynamiquement les zones de prix optimales pour les entrées et sorties.
Indicator
ATR
RSI
+19
Multi-timeframe heatmap scoring Direction, Strength & Volatility at a glance!
Indicator
Plot higher-timeframe Bollinger Bands for clearer structure, pullback zones, and breakout signals—without switching char
Indicator
AI
ATR
+20
Algorithmic trend precision for cTrader.
Indicator
Prop
Forex
+5
Transform your approach to trading with our innovative Pivot Point Indicator.
Indicator
ATR
RSI
+7
Identify bullish and bearish Order Blocks to spot key support/resistance levels and potential trend reversals! 📈🔄
Indicator
Volume
Custom range volume profile between two draggable anchors. Auto source timeframe, Total/Up-Down/Delta, POC, Value Area.
Indicator
Channel
Imbalance
+2
Adaptive volatility channel based on moving average and standard deviation (σ).
Indicator
ADX
ATR
+2
GOLD SENTINEL v1.0 - A CANDLE-COLORING INDICATOR FOR GOLD.
Indicator
MACD
Prop
+8
NTNPICLL is a tool to check the best trading hours for the assets and also includes the highest and lowest point

Price

82.74M
Traded volume
50.16K
Pips won
6
Sales
445
Free installs