
RT Consolidation Zones
Indicador
1 compras
Versão 1.0, Sep 2024
Windows, Mac
Descrição
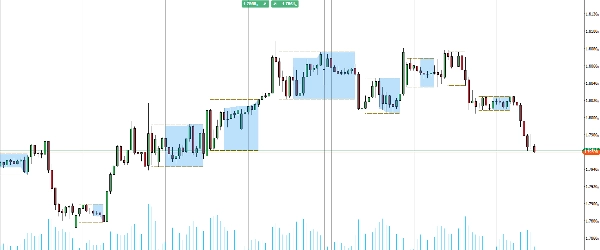
Apresentando o indicador Zonas de Consolidação, projetado para ajudá-lo a identificar e aproveitar oportunidades de rompimento com facilidade.
Esta ferramenta poderosa destaca zonas no seu gráfico onde o preço está se consolidando, facilitando a identificação de pontos potenciais de rompimento. Ao visualizar essas áreas críticas, você pode antecipar melhor os movimentos do mercado e tomar decisões de negociação mais informadas.
Ideal para traders que desejam aprimorar sua estratégia com insights claros e acionáveis, atualize seu conjunto de ferramentas de negociação e domine os rompimentos com o indicador Zonas de Consolidação.
Resumo
Perfil do indicador
Avaliações de clientes
0.0
Avaliações: 0
Avaliações de clientes
Ainda não há avaliações para este produto. Já o experimentou? Seja o primeiro a contar a outras pessoas!
Conversa
Perguntas frequentes
BTCUSD
Forex
Breakout
Indices
EURUSD
Commodities
GBPUSD
NZDUSD
Prop
Crypto
Stocks
XAUUSD
NAS100
USDJPY
Os produtos disponíveis através da cTrader Store, incluindo bots de negociação, indicadores e plugins, são fornecidos por programadores terceiros e são disponibilizados apenas para fins informativos e de acesso técnico. A cTrader Store não é um corretor e não fornece aconselhamento em matéria de investimento, recomendações pessoais ou qualquer garantia de desempenho no futuro.


Preço
Desde 25/09/2024
20
Vendas