
Beschreibung
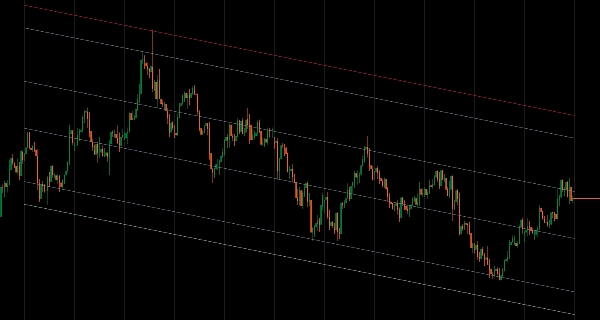
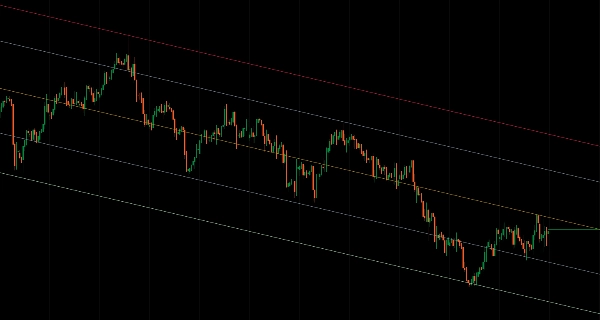
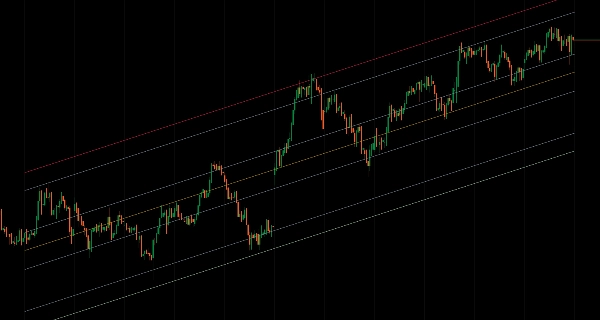
Statistische Preiskanäle mit flexiblen Berechnungsmethoden und abweichungsbasierter Banddarstellung.
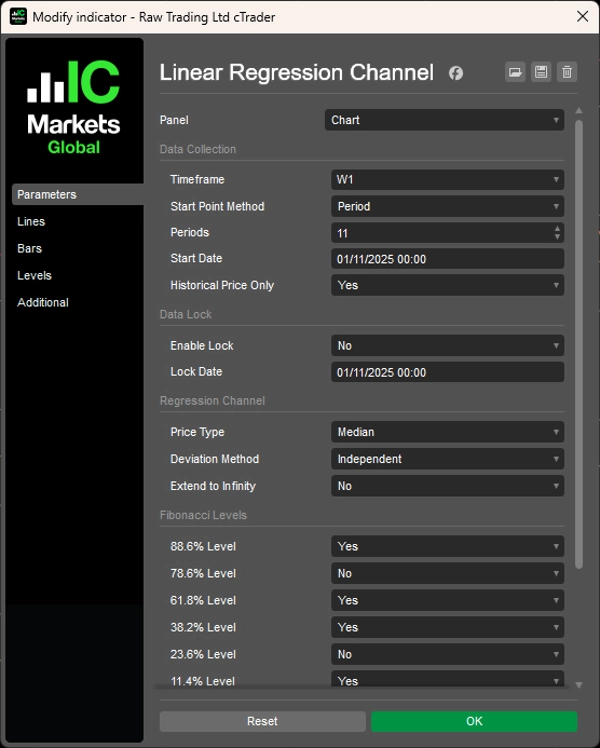
Passt Regressionslinien durch Preisdaten an, unter Verwendung des Periodenmodus (letzte N Kerzen), Datumszeitmodus (ab bestimmten Daten) oder Sperrmechanismus, um die Analyse an historischen Punkten einzufrieren, während der Preis weiterläuft.
Drei Abweichungsmethoden (Durchschnitt, Unabhängig, Maximum) für symmetrische und asymmetrische Kanäle, sechs Fibonacci-Retracement-Level (11,4 % bis 88,6 %), Multi-Timeframe-Analyse, sechs Preistypen (Open/High/Low/Close/Median/Typical), nur historischer Modus für stabile Backtests und Projektion bis ins Unendliche bieten umfassende Regressionsanalysen für Trader, die Mittelwertumkehrzonen und statistische Preisgrenzen unter verschiedenen Marktbedingungen anvisieren.
EIGENSCHAFTEN
Flexible Datenauswahl
- Periodenmodus: Analyse der letzten N Kerzen (z. B. letzte 12 Monatskerzen)
- Datumszeitmodus: Start ab bestimmten Marktereignissen oder Daten
- Sperrmechanismus: Analyse an einem historischen Punkt einfrieren, während der Preis weiterläuft
- Multi-Timeframe: Regression aus jedem Zeitrahmen auf Ihrem aktuellen Chart zeichnen
Intelligente Abweichungsmethoden
- Durchschnitt: Ausgewogene Niveaus mit mittleren Abweichungen – ideal für Handelszonen
- Unabhängig: Asymmetrische Kanäle, die sich an richtungsabhängige Volatilität anpassen
- Maximum: Zeigt extreme Preisgrenzen für vollständige Bereichsanalyse
Professionelle Analysetools
- 6 Fibonacci-Retracement-Level (11,4 %, 23,6 %, 38,2 %, 61,8 %, 78,6 %, 88,6 %)
- 6 Preistypen: Open, High, Low, Close, Median, Typical
- Nur historischer Modus: Ausschluss von sich bildenden Kerzen für stabile Backtests
- Option zur Projektion ins Unendliche für langfristige Vorhersagen
Volle Anpassungsmöglichkeiten
- Komplette Farbgestaltung für alle Kanalelemente
- Unabhängige Steuerung der Regressionslinie und der Abweichungsbänder
- Saubere visuelle Darstellung für fokussierte Analyse
Erweiterte Funktionen
- Sperrfunktion für ereignisbasierte Analyse-Studien
- Kombination von höherem Zeitrahmen mit Ausführung im niedrigeren Zeitrahmen
- Symmetrische und asymmetrische Kanaloptionen für verschiedene Marktbedingungen
__________________________________________________________________________________________
MEHR KOSTENLOSE INDIKATOREN
Entdecken Sie eine breite Palette von Marktanalysetools – von Struktur und Volumen bis hin zu Regression, Volatilität und benutzerdefinierten Zeitrahmen.
Der Quellcode ist auf GitHub Repository verfügbar.
Alle kostenlos nutzbar. Wenn Sie jedoch eine Kaffee-Unterstützung senden möchten, können Sie dies hier tun.
Unterstützung/Widerstand
Volumen
- Volumen-Aktivitätsprofiler
- Volumen-Effizienz-Analysator
- Volumenprofil-Analyse
- Volumenprofil - Aktualisiert
- Volumen-Spread-Analyse
- VWAP (Volumen-gewichteter Durchschnittspreis)
Gleitende Durchschnitte
- SSL-Kanal
- Verankerter gleitender Durchschnitt
- Abweichungsskaliertes gleitendes Mittel
- Gann High Low Aktivator
- Instantane Trendlinie
- Kaufman Adaptive MA mit Trend Vision
- Gleitender Durchschnittskanal
- Gleitende Durchschnitte Suite
- Trendkanal gleitender Durchschnitt
Dienstprogramme/Benutzerdefiniert
Regressionsbasiert
Volatilität
Oszillatoren
__________________________________________________________________________________________
HAFTUNGSAUSSCHLUSS
Der Handel ist mit Risiken verbunden. Dieser Indikator dient ausschließlich der technischen Analyse – wenden Sie stets ein angemessenes Risikomanagement an und handeln Sie verantwortungsbewusst.
FEEDBACK & VERBESSERUNGEN
Wenn Sie Vorschläge, Funktionswünsche oder Ideen zur Verbesserung haben, hinterlassen Sie bitte einen Kommentar im Diskussions-Tab. Ihr Feedback hilft, den Indikator für alle zu verbessern.
Zusammenfassung
Kundenbewertungen
5 | 100 % | |
4 | 0 % | |
3 | 0 % | |
2 | 0 % | |
1 | 0 % |


