Beschreibung
ÜBERSICHT
Grundlage: Wyckoff-Prinzipien
Dieser Indikator basiert auf zwei sich ergänzenden Konzepten der Wyckoff-Methodik:
1. Aufwand vs Ergebnis
Das zentrale Wyckoff-Prinzip besagt, dass die Kursbewegung (Ergebnis) proportional zum dahinterstehenden Volumen (Aufwand) sein sollte. Wenn Aufwand und Ergebnis im Einklang stehen, verhält sich der Markt normal. Wenn sie auseinanderlaufen, signalisiert dies potenzielle Wendepunkte oder Fortsetzungsstärke.
Dieser Indikator setzt dies direkt durch die Effizienz-Metrik (Ergebnis pro Einheit Aufwand) und deren Umkehrung, Absorption (Aufwand, der sich nicht ins Ergebnis übersetzt), um.
2. Spread-Analyse
Wyckoff betonte auch die Analyse des Charakters einzelner Kurskerzen – Untersuchung des Spreads (Bereich), wo der Kurs innerhalb dieses Bereichs schloss und ob die Kerze Entschlossenheit oder Unentschlossenheit zeigte.
Dieser Indikator implementiert die Spread-Analyse durch Überzeugung (gerichtete Entschlossenheit), Verschwendung (Rücksetzer innerhalb der Kerze) und Schlussposition (wird verwendet, um Absorption als Akkumulation oder Distribution zu kontextualisieren).
WAS DIESER INDIKATOR TUT
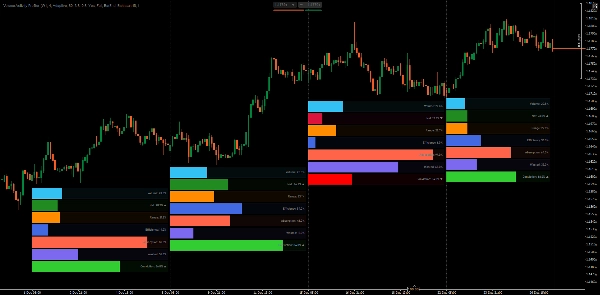
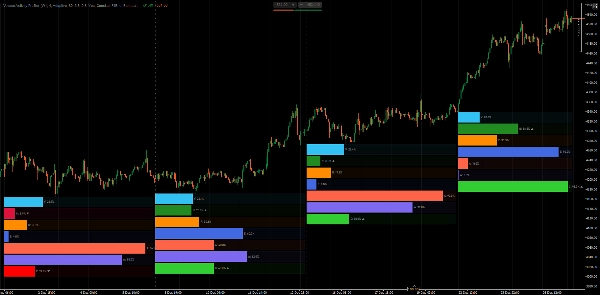
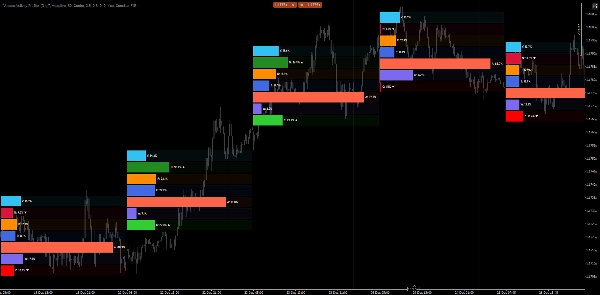
Der Volume Activity Profiler analysiert Kurskerzen aus einem ausgewählten Zeitrahmen und zerlegt deren Aktivität in messbare Komponenten. Er berechnet sowohl Rohmetriken als auch abgeleitete, auf Perzentilen basierende Metriken und zeigt diese als horizontale Balkendiagramme unter jeder analysierten Kerze an.
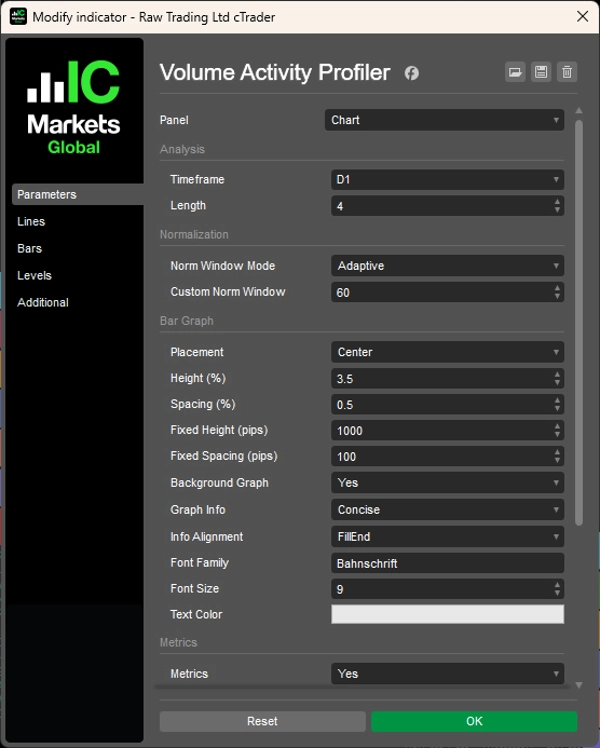
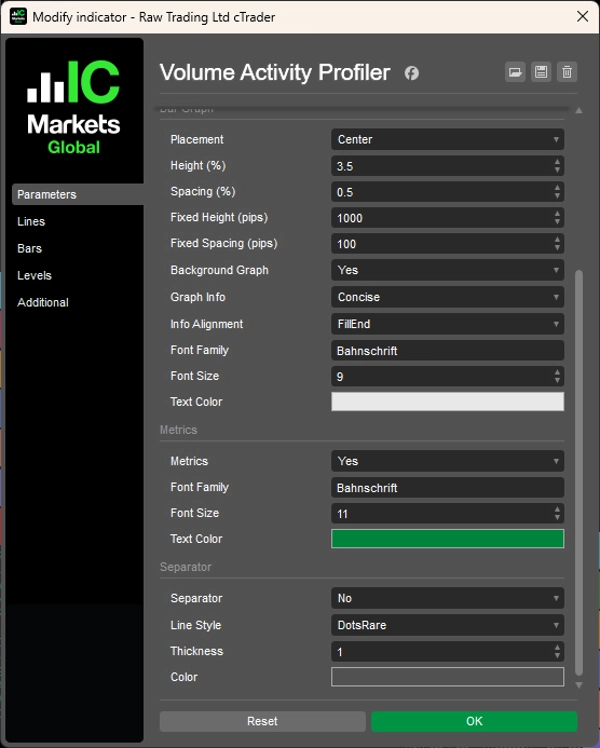
Sie konfigurieren zwei Hauptparameter:
- Zeitrahmen: Der zu analysierende Zeitraum (z. B. Wöchentlich, Täglich, H4)
- Länge: Wie viele Kerzen profiliert werden sollen (z. B. letzte 4 Kerzen)
Der Indikator profiliert dann jede Kerze innerhalb dieses Bereichs, berechnet Metriken und ordnet sie zueinander und zu historischen Normen ein.
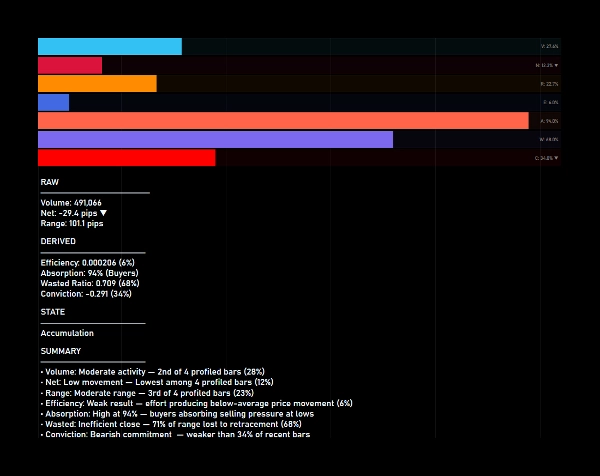
ERKLÄRUNG DER METRIKEN
Rohmetriken (proportional unter profilierten Kerzen):
1. Volumen
Tick-Volumen der Kerze. Zeigt, welchen Anteil am gesamten profilierten Volumen diese Kerze darstellt.
2. Netto
Richtungsbewegung (Schluss − Eröffnung) in Pips. Zeigt den Anteil der gesamten Netto-Bewegung. Farbe zeigt Richtung an (grün = bullisch, rot = bärisch).
3. Range
Gesamte Kursrange (Hoch − Tief) in Pips. Zeigt den Anteil der gesamten Range unter den profilierten Kerzen.
Abgeleitete Metriken (auf Perzentilen basierend gegenüber historischem Fenster):
1. Effizienz (Aufwand vs Ergebnis)
Range pro Volumeneinheit. Hohe Effizienz bedeutet, dass Aufwand in Kursbewegung umgesetzt wird. Niedrige Effizienz deutet auf Absorption oder Widerstand hin.
2. Absorption (Aufwand vs Ergebnis)
Umkehrung der Effizienz. Hohe Absorption zeigt, dass Volumen aufgenommen wird, ohne proportionale Kursbewegung – potenzielle Akkumulation oder Distribution.
3. Verschwendung (Spread-Analyse)
Prozentsatz der Range, der durch Rücksetzer verloren geht (Range − Netto) / Range. Hohe Verschwendung bedeutet, dass die Kerze einen Großteil ihrer Bewegung zurückgab. Niedrige Verschwendung zeigt eine klare, gerichtete Kerze.
4. Überzeugung (Spread-Analyse)
Richtungsentschlossenheit gemessen als Netto/Range. Hohe Überzeugung bedeutet, dass die Kerze nahe ihrem Extrem schloss. Niedrige Überzeugung zeigt Unentschlossenheit oder Ablehnung.
VERSTÄNDNIS DER BALKENDIAGRAMME
Jede profilierte Kerze zeigt 7 horizontale Balken:
- Volumen, Netto, Range — Gefüllt basierend auf dem Anteil unter profilierten Kerzen
- Effizienz, Absorption, Verschwendung, Überzeugung — Gefüllt basierend auf Perzentilrang gegenüber historischen Daten
Ein Balken, der zu 80 % bei Effizienz gefüllt ist, bedeutet, dass die Effizienz dieser Kerze höher ist als bei 80 % der Kerzen im Normalisierungsfenster.
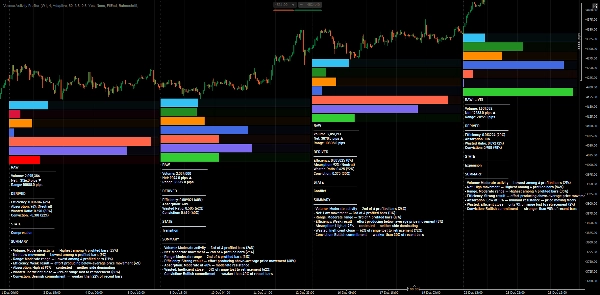
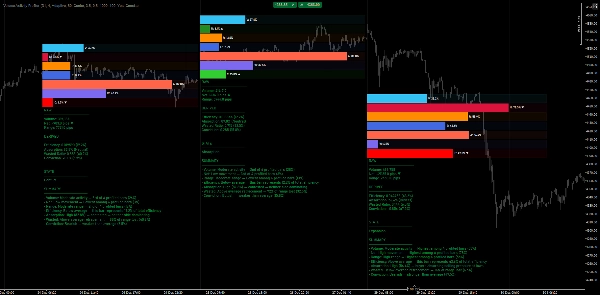
KLASSIFIZIERUNG DES AKTIVITÄTSZUSTANDS
Wenn die Anzeige der Metriken aktiviert ist, klassifiziert der Indikator jede Kerze in einen dieser Zustände:
1. Kompression
Niedrige Effizienz + niedrige Überzeugung — der Kurs wickelt sich zusammen, potenzielle Energie baut sich auf
2. Expansion
Hohe Effizienz + hohe Überzeugung + geringe Verschwendung — starke gerichtete Bewegung
3. Konflikt
Hohe Verschwendung + niedrige Überzeugung — Kampf zwischen Käufern und Verkäufern
4. Akkumulation
Hohe Absorption + Schluss nahe Tiefs — Käufer absorbieren Verkaufsdruck
5. Distribution
Hohe Absorption + Schluss nahe Hochs — Verkäufer absorbieren Kaufdruck
6. Ablehnung
Hohe Überzeugung, aber Schluss entgegen der Richtung — gescheiterte Bewegung, potenzielle Umkehr
7. Übergang
Gemischte Signale — Markt im Übergang zwischen Zuständen
PRAKTISCHE VORTEILE
- Schnelle Aufwand-gegen-Ergebnis-Bewertung — Sofort sehen, ob Volumen proportionale Bewegung erzeugt oder absorbiert wird.
- Multi-Zeitrahmen-Strukturanalyse — Höhere Zeitrahmen analysieren, während Sie im Ausführungszeitrahmen bleiben.
- Akkumulation/Distribution identifizieren — Hohe Absorption mit Schlussposition zeigt, wo große Marktteilnehmer aktiv sein könnten.
- Erschöpfung und Ablehnung erkennen — Hohe Überzeugung mit entgegengesetzter Schlussposition warnt vor potenziellen Umkehrungen.
- Kerzen objektiv vergleichen — Ranglisten und Perzentile entfernen Subjektivität bei der Bewertung von „hohem“ oder „niedrigem“ Volumen.
- Ausbrüche bestätigen — Expansionszustand mit hoher Effizienz und Überzeugung bestätigt echtes Ausbruchsinteresse.
TICK-VOLUMEN ALS AUFWAND-ERSATZ
Dieser Indikator verwendet Tick-Volumen als Aufwandseingabe. Im Forex repräsentiert Tick-Volumen die Häufigkeit von Kursänderungen und nicht das tatsächlich gehandelte Volumen – eine bekannte Einschränkung dezentraler Märkte.
Dennoch dient Tick-Volumen effektiv als Aufwand-Ersatz, weil:
- Es die relative Marktaktivität zwischen Kerzen widerspiegelt
- Hohe Tick-Zahlen auf eine erhöhte Teilnehmeraktivität hinweisen
- Die Beziehung Aufwand vs Ergebnis erhalten bleibt – hohe Aktivität mit wenig Bewegung signalisiert dennoch Absorption
Die Perzentil-Ranglisten und Balkenvergleiche des Indikators bleiben gültig, solange die Daten konsistent sind.
HINWEISE
- Der Indikator verwendet adaptive Normalisierungsfenster basierend auf dem Zeitrahmen, wenn der Adaptive-Modus eingestellt ist, um relevanten historischen Kontext zu gewährleisten.
- Perzentilberechnungen werden nur bei abgeschlossenen Kerzen aktualisiert, um instabile Werte bei sich bildenden Kerzen zu vermeiden.
- Die aktuell sich bildende Kerze wird im Metrik-Panel mit [LIVE] markiert.
__________________________________________________________________________________________
MEHR KOSTENLOSE INDIKATOREN
Entdecken Sie eine breite Palette von Marktanalysetools – von Struktur und Volumen bis Regression, Volatilität und benutzerdefinierten Zeitrahmen.
Der Quellcode ist im GitHub Repository verfügbar.
Alle kostenlos nutzbar. Aber wenn Sie Lust haben, eine Kaffee-Unterstützung zu senden, können Sie diese hierhinleiten.
Unterstützung/Widerstand
Volumen
- Volume Activity Profiler
- Volume Efficiency Analyzer
- Volume Profile Analytics
- Volume Profile - Aktualisiert
- Volume Spread Analysis
- VWAP (Volumen-Gewichteter Durchschnittspreis)
Gleitende Durchschnitte
- SSL-Kanal
- Verankerter gleitender Durchschnitt
- Abweichungsskaliertes gleitendes Mittel
- Gann High Low Aktivator
- Instantane Trendlinie
- Kaufman Adaptive MA mit Trend Vision
- Gleitender Durchschnittskanal
- Gleitende Durchschnitte Suite
- Trendkanal gleitender Durchschnitt
Dienstprogramme/Benutzerdefiniert
Regressionsbasiert
Volatilität
Oszillatoren
__________________________________________________________________________________________
HAFTUNGSAUSSCHLUSS
Trading beinhaltet Risiken. Dieser Indikator ist nur für die technische Analyse gedacht – wenden Sie stets ein angemessenes Risikomanagement an und handeln Sie verantwortungsbewusst.
FEEDBACK & VERBESSERUNGEN
Wenn Sie Vorschläge, Funktionswünsche oder Ideen zur Verbesserung haben, hinterlassen Sie bitte einen Kommentar im Diskussions-Tab. Ihr Feedback hilft, den Indikator für alle zu verbessern.
Zusammenfassung
The indicator profiles price bars over a user-selected timeframe and length, calculating raw metrics such as Volume (tick volume proportion), Net (directional price movement), and Range (price range). It also derives percentile-based metrics including Efficiency (price movement per volume unit), Absorption (volume without proportional price change), Wasted Ratio (retracement within the bar), and Conviction (directional commitment).
These metrics are visually represented as horizontal bar graphs beneath each analyzed bar, facilitating objective comparison and historical context. The indicator classifies bars into activity states like Compression, Expansion, Conflict, Accumulation, Distribution, Rejection, and Transition, aiding in identifying market phases and potential turning points.
Volume Activity Profiler uses tick volume as an effort proxy, reflecting relative market activity. It supports multi-timeframe analysis and updates percentile rankings on completed bars to ensure stable readings. This tool assists traders in assessing volume efficiency, spotting accumulation/distribution, confirming breakouts, and understanding market structure through quantitative volume and price bar analysis.
Kundenbewertungen
5 | 100 % | |
4 | 0 % | |
3 | 0 % | |
2 | 0 % | |
1 | 0 % |