Trading product for Initial Balance Indikator Fibonacci Breakout, image 1
Indikator
227 downloads
Version 1.0, Nov 2025
Windows, Mac
4.5
Bewertungen: 2
Trading product for Initial Balance Indikator Fibonacci Breakout, image 2
Trading product for Initial Balance Indikator Fibonacci Breakout, image 3
Trading product for Initial Balance Indikator Fibonacci Breakout, image 4
Trading product for Initial Balance Indikator Fibonacci Breakout, image 5
Trading product for Initial Balance Indikator Fibonacci Breakout, image 6
Trading product for Initial Balance Indikator Fibonacci Breakout, image 7
Seit 20/12/2024
7.7K
Kostenlose Installationen

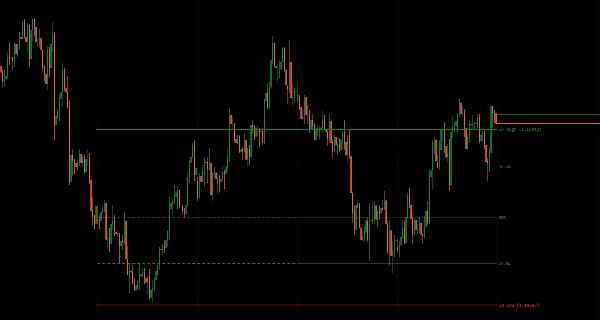
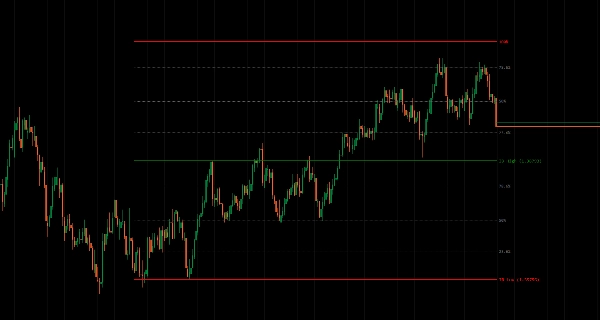
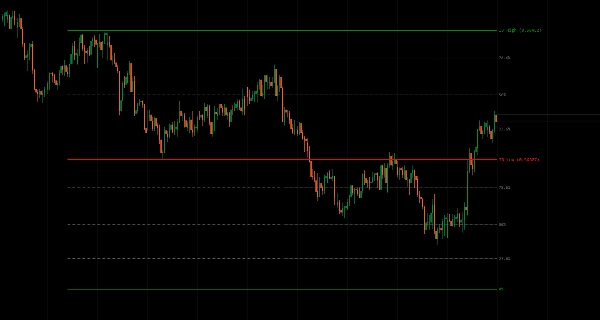
Eröffnungsbereichsstruktur über jeden Zeitraum hinweg – Intraday-Sitzungen bis hin zu Jahreszyklen – mit Fibonacci-Niveaus und Erweiterungsprojektionen.


Markiert den während der Eröffnungsperioden (täglich, wöchentlich, monatlich, vierteljährlich, jährlich oder benutzerdefinierter Bereich) festgelegten Hoch-/Tiefbereich als Referenz für Ausbrüche, Mittelwertumkehr und Volatilitätserwartungen.

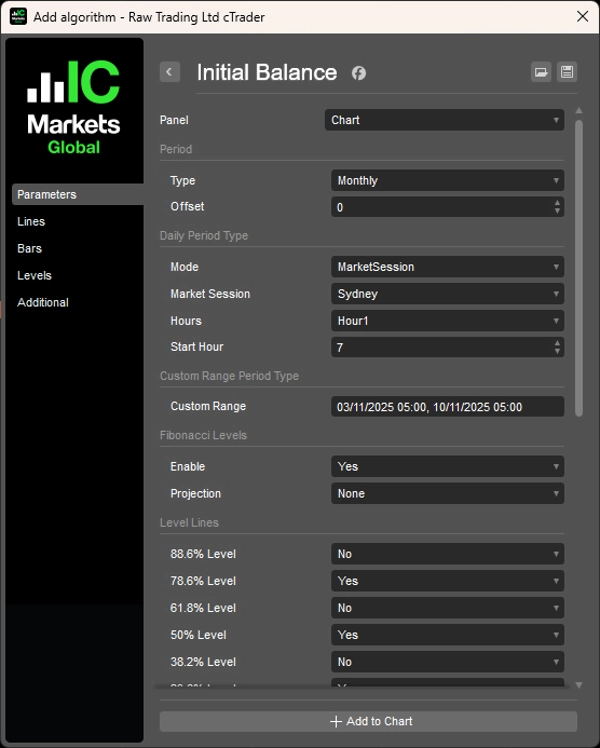
Acht Periodentypen mit zeitzonenbewusster Sitzungs-Erkennung (Sydney/Tokio/London/NY), historischem Versatz für Mehrperiodenvergleiche, optional sieben Fibonacci-Niveaus (11,4 % bis 88,6 %) innerhalb des IB-Bereichs, Aufwärts-/Abwärtsprojektionen von den Grenzen, flexible Steuerung der Linienverlängerung (nur IB-Periode, aktueller Balken oder N Perioden vorwärts) und präzise Periodenerkennung bieten eine umfassende Eröffnungsbereichsanalyse für Trader, die strukturbasierte Setups über alle Zeitrahmen anstreben.


FUNKTIONEN


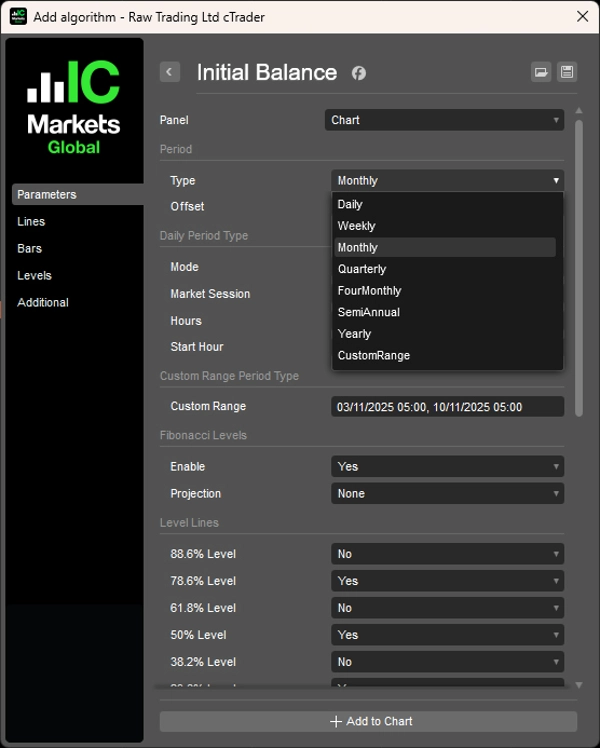
8 Periodentypen

  • Täglich, Wöchentlich, Monatlich, Vierteljährlich, 4-Monat, Halbjährlich, Jährlich, Benutzerdefinierter Bereich
  • Tägliche Modi: Stundenbasiert (1-12 Stunden) oder Marktsitzung (Sydney/Tokio/London/NY)
  • Konfigurierbare Sitzungsstartzeiten mit zeitzonenbewusster UTC-Versatzanpassung
  • Benutzerdefinierter Bereich: Definieren Sie genaue Start-/Endzeitpunkte für ereignisbasierte Analysen


Historische Perioden

  • Versatzparameter zur Ansicht vergangener IB-Bereiche (z. B. IB der letzten Woche, IB des letzten Monats)
  • Vergleich der aktuellen Kursbewegung mit vorherigen Periodenstrukturen
  • Mehrperiodenanalyse zur Trendbestätigung


Fibonacci-Niveaus

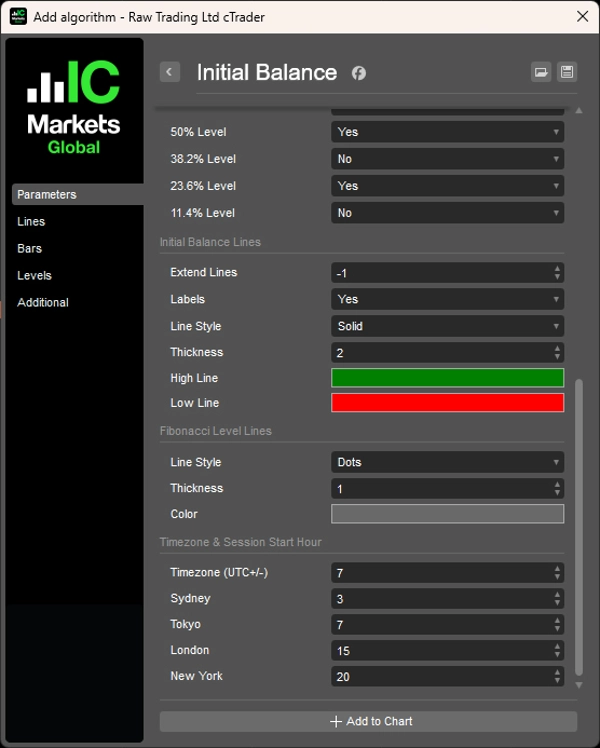
  • Optionale 7 Niveaus (11,4 %, 23,6 %, 38,2 %, 50 %, 61,8 %, 78,6 %, 88,6 %) innerhalb des IB-Bereichs
  • Mittelwertumkehrzonen innerhalb des Gleichgewichts
  • Präzise Ein- und Ausstiegspunkte als Referenz


Fibonacci-Projektionen

  • Projektion der Niveaus aufwärts/abwärts vom IB-Hoch/Tief
  • Potenzielle Ausbruchsziele außerhalb des Bereichs
  • Erweiterungszonen für richtungsweisende Bewegungen


Linienverlängerungssteuerung

  • Nur IB-Periode: Zeigt den Bereich während der Entstehungsperiode
  • Aktueller Balken: Verlängert bis zur Gegenwart
  • N Perioden vorwärts: Projektion in die Zukunft zur Planung
  • Sauberes visuelles Management


Präzise Periodenerkennung

  • Genaue Berechnung des Eröffnungsbereichs für jeden Periodentyp
  • Zeitzonenbewusst für globale Märkte
  • Handhabt Sitzungsüberlappungen und Übergänge sauber


__________________________________________________________________________________________


MEHR KOSTENLOSE INDIKATOREN


Entdecken Sie eine breite Palette von Marktanalysetools – von Struktur und Volumen bis hin zu Regression, Volatilität und benutzerdefinierten Zeitrahmen.

Der Quellcode ist auf GitHub Repository verfügbar.

Alle kostenlos nutzbar. Aber wenn Sie Lust haben, eine Kaffee-Unterstützung zu senden, können Sie sie hierhinleiten.


Unterstützung/Widerstand


Volumen


Gleitende Durchschnitte


Dienstprogramme/Benutzerdefiniert


Regression-basiert


Volatilität


Oszillatoren


__________________________________________________________________________________________


HAFTUNGSAUSSCHLUSS

Der Handel ist mit Risiken verbunden. Dieser Indikator ist nur für die technische Analyse gedacht – wenden Sie stets ein angemessenes Risikomanagement an und handeln Sie verantwortungsbewusst.


FEEDBACK & VERBESSERUNGEN

Wenn Sie Vorschläge, Funktionswünsche oder Ideen zur Verbesserung haben, hinterlassen Sie bitte einen Kommentar im Diskussions-Tab. Ihr Feedback hilft, den Indikator für alle zu verbessern.

Indikatorprofil
4.5
Bewertungen: 2
5
50 %
4
50 %
3
0 %
2
0 %
1
0 %
Kundenbewertungen
April 30, 2026
Precision Structural Mapping & Session Analysis. This tool provides a masterful implementation of Opening Range theory across all cycles. Its timezone-aware session detection and dual-mode logic offer surgical precision for London/NY opens. The integration of internal Fibonacci levels and external projections transforms basic ranges into a complete roadmap for breakouts. A highly optimized, essential tool for traders focused on institutional market structure and volatility zones.
December 1, 2025
Initial Balance marks the day’s opening range and works well on mid/high timeframes. Great for volatility and session-structure analysis. However, IB does not appear on lower TFs (M1-M5), limiting intraday use. With lower-TF support and breakout alerts, this tool would be excellent.
Fibonacci
Breakout
Über den cTrader Store verfügbare Produkte, einschließlich Handelsbots, Indikatoren und Plugins, werden von externen Entwicklern bereitgestellt und nur zu Informations- und technischen Zugriffszwecken verfügbar gemacht. cTrader Store ist kein Broker und erbringt keine Anlageberatung, persönlichen Empfehlungen oder eine Garantie für zukünftige Performance.

Mehr von diesem Autor

Indikator
VWAP
Customizable VWAP with flexible reset, three band methods, and full Fibonacci level control.
Indikator
Fibonacci
Fair Value Gap
Detect FVGs with age, status, Fibonacci levels, and customizable fill threshold—extended version.
Indikator
Fibonacci
Clear pivot levels. Clean S/R zones. Five methods. Any timeframe.
Indikator
Forex
Crypto
+3
Volume distribution analysis with Market Profile TPO integration.
Indikator
Forex
Crypto
+3
Custom and native timeframes display with OHLC lines, moving averages, and Fibonacci levels.
Indikator
Forex
Crypto
+3
VSA indicator analyzing volume, spread, and close location to detect supply/demand imbalances.
Indikator
Forex
Crypto
+3
28-method MA library in one indicator — from classic EMAs to adaptive & zero-lag variants.
Indikator
Breakout
Plots automatic psychological levels at round-number zones – major structure & liquidity levels.
Indikator
Breakout
Fibonacci
Statistically-grounded trend channels via linear regression — clear trend & reversal zones.
Indikator
Forex
Crypto
+3
John Ehlers' trendline using signal processing to filter cycle noise and identify trends with minimal lag.
Indikator
Forex
Crypto
+3
Volume profiler applying Wyckoff effort vs result and spread analysis with visual bar graphs.
Indikator
Bollinger
Complete MA-channel system: colored trend, channel boundaries & equilibrium with 6 Fib zones.

Das könnte Sie auch noch interessieren

Indikator
Indices
Multi-Timeframe ADX Trend Dots & Arrows
Indikator
The Advanced Volume Profile Indicator calculates POC, Median, and Mode, revealing key price levels for smarter trading.
Indikator
Displays the previous day's, last week's, and last month's highest and lowest price levels on your chart.
Indikator
ATR
RSI
+11
This indicator puts three helpful trading tools on your chart at once. Think of it like having three expert traders
Indikator
RSI
SMC
+17
RSI, MACD, Stochastic, CCI & Momentum divergence scanner with confluence scoring. Never miss a signal again!
Indikator
Volume
Key Levels
+4
Session & Kill Zone Highlighter - Visual tool for London, NY, Tokyo, Sydney sessions plus ICT Kill Zones.
Indikator
Prop
Forex
+14
Amplitude Momentum Optimizer — FREE TRIAL Version to Find Out If the Complete Indicator Has a Real Edge.
Indikator
Grid
Prop
+14
Visualize trends with Standard Deviation Channel! Display median, and add customizable upper/lower deviation channels.
Indikator
Supply & Demand
Support & Resistance
RAF Supply Demand Lite v1.0 automatically detects clean Supply and Demand zones using confirmed swing highs and lows. Zo
Indikator
ATR
Prop
+6
🟢 Strength-ranked S/R zones with MTF levels and Pro labels. Nearest-zone band and HUD for faster, cleaner entries. 🔴
Indikator
MACD
Prop
+8
NTNPICLL is a tool to check the best trading hours for the assets and also includes the highest and lowest point
Indikator
ATR
CCI
+5
An institutional-grade trading system fusing triple hybrid moving averages, multi-oscillator momentum filters, Fair Valu
Indikator
Order Block
Fair Value Gap
+3
This indicator scans multi-timeframe trend confluence and price action triggers within key supply/demand zones
Indikator
BOS
Key Levels
+4
Automatically plots the Opening Range Breakout (ORB) box for all 3 major session: Asia, London and New York
Indikator
ADX
ATR
+2
Quantum Breakout Pro Professional Breakout Indicator for cTrader
Indikator
AI
ATR
+26
SR Commander — Multi Timeframe Edition. See where the big money draws the line. Trade on your timeframe. Think on theirs
Indikator
Support and Resistance.
Indikator
Daily Pivot Points plots key support and resistance levels to guide precise trading decisions.
Seit 20/12/2024
7.7K
Kostenlose Installationen