
Beschreibung
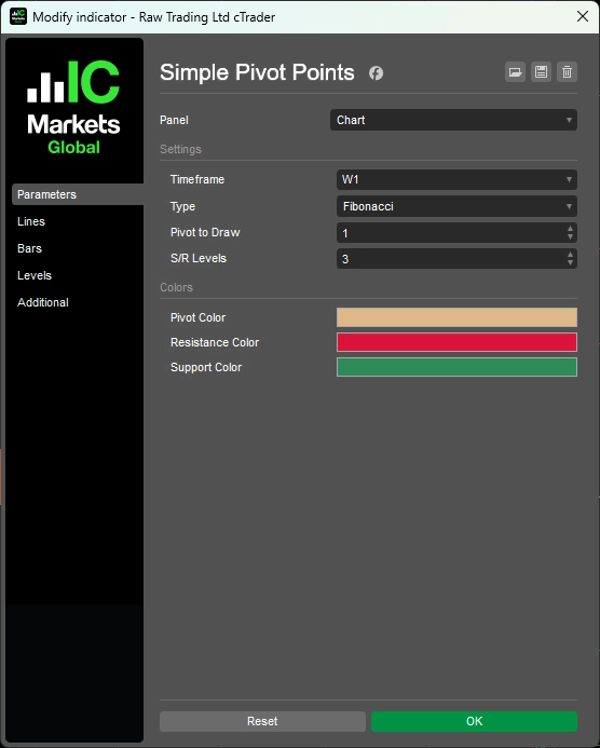
Berechnen Sie Unterstützungs- und Widerstandsniveaus mit fünf professionellen Pivot-Methoden über jeden Zeitraum hinweg.
Erzeugt automatisch Pivot-Level (Standard, Fibonacci, Woodie, Camarilla, DeMark) von M5 bis Monatsdaten mit zeitlich begrenzter Anzeige für jeden Zeitraum.
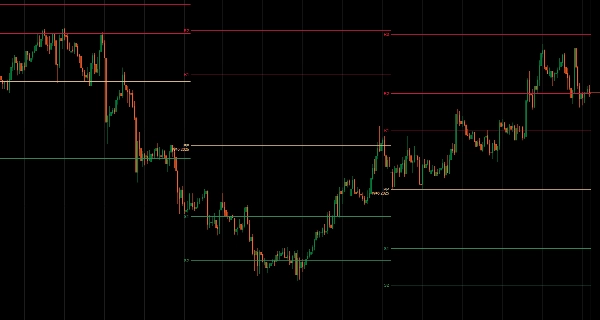
Fünf Berechnungsalgorithmen mit unterschiedlicher S/R-Abstandslogik, konfigurierbare Unterstützungs-/Widerstandsniveaus (0-6 pro Seite), historische Pivot-Anzeige für mehrere vorherige Perioden, automatisch beschriftete Linien (PP, R1-R6, S1-S6) und farbcodierte Visualisierung bieten institutionelle Pivot-Analyse für Trader, die auf wichtige Kursniveaus und Intraday-Umkehrungen abzielen.
FUNKTIONEN
Fünf Berechnungsmethoden
- Standard: Klassische Floor-Trader-Formel – die weltweit am meisten beobachteten Pivots
- Fibonacci: Verwendet Fib-Verhältnisse (38,2 %, 61,8 %, 100 %, 138,2 %, 161,8 %) für S/R-Abstände
- Woodie: Gewichtet den Schlusskurs stark – reaktiver auf die jüngste Kursbewegung
- Camarilla: Enge Intraday-Niveaus mit 1,1/12-Multiplikatoren – beliebt beim Scalping
- DeMark: Bedingte Formel basierend auf dem Verhältnis von Schluss- zu Eröffnungskurs – nur 1 S/R-Level, aber sehr angesehen
Volle Anpassung
- Jeder Zeitraum: Berechnung ab M5, H1, H4, täglich, wöchentlich, monatlich
- Historische Pivots: Anzeige von bis zu mehreren vorherigen Perioden (z. B. letzte 3 Wochen Pivots)
- Konfigurierbare Levels: Anzeige von 0-6 Unterstützungs-/Widerstandsniveaus pro Seite
- Automatisch beschriftete Linien: PP, R1-R6, S1-S6 klar markiert
- Zeitlich begrenzte Linien: Pivots jeder Periode werden nur für die Dauer dieser Periode angezeigt
- Farbcodiert: Pivot (beige), Widerstand (rot), Unterstützung (grün)
__________________________________________________________________________________________
MEHR KOSTENLOSE INDIKATOREN
Entdecken Sie eine breite Palette von Marktanalysetools – von Struktur und Volumen bis Regression, Volatilität und benutzerdefinierten Zeitrahmen.
Der Quellcode ist auf GitHub Repository verfügbar.
Alle kostenlos nutzbar. Wenn Sie jedoch Kaffeeunterstützung senden möchten, können Sie dies hier tun.
Unterstützung/Widerstand
Volumen
- Volumen-Aktivitätsprofiler
- Volumen-Effizienz-Analysator
- Volumenprofil-Analyse
- Volumenprofil - Aktualisiert
- Volumenstreuungsanalyse
- VWAP (Volumen-gewichteter Durchschnittspreis)
Gleitende Durchschnitte
- SSL-Kanal
- Verankerter gleitender Durchschnitt
- Abweichungsskaliertes gleitendes Mittel
- Gann High Low Aktivator
- Instantane Trendlinie
- Kaufman Adaptive MA mit Trend Vision
- Gleitender Durchschnittskanal
- Gleitende Durchschnitte Suite
- Trendkanal gleitender Durchschnitt
Dienstprogramme/Benutzerdefiniert
Regressionsbasiert
Volatilität
Oszillatoren
__________________________________________________________________________________________
HAFTUNGSAUSSCHLUSS
Der Handel ist mit Risiken verbunden. Dieser Indikator dient nur zur technischen Analyse – wenden Sie stets ein angemessenes Risikomanagement an und handeln Sie verantwortungsbewusst.
FEEDBACK & VERBESSERUNGEN
Wenn Sie Vorschläge, Funktionswünsche oder Ideen zur Verbesserung haben, hinterlassen Sie bitte einen Kommentar im Diskussions-Tab. Ihr Feedback hilft, den Indikator für alle zu verbessern.
Zusammenfassung
Kundenbewertungen
5 | 100 % | |
4 | 0 % | |
3 | 0 % | |
2 | 0 % | |
1 | 0 % |


![„[CB] Pivot Points Pro“-Logo](https://cdn.ctrader.com/image/webp/43463c82-67b0-4f10-a4ba-901bba091d81_32594)


