
Beschreibung
Ein sauberer, einfacher und sehr visueller Indikator, der Kreuzungen zwischen zwei Simple Moving Averages (SMA) erkennt und alles klar im Chart anzeigt.
Hauptmerkmale:
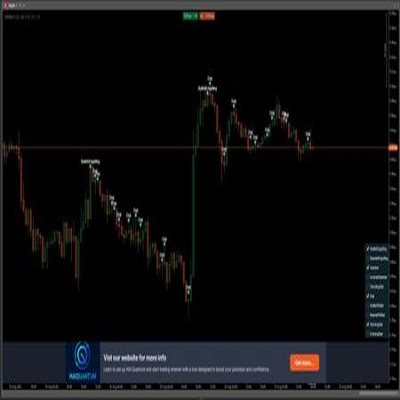
- Große farbige Pfeile genau am Kreuzungspunkt → Limettengrün ↑ → Bullisches Kreuz (potenzieller Kauf) → Rot ↓ → Bärisches Kreuz (potenzieller Verkauf)
- Permanentes Statusfeld in der oberen rechten Ecke des Charts → Art der letzten Kreuzung (BULLISCH / BÄRISCH / WARTEN) → Exaktes Datum und Uhrzeit der Kreuzung → Konfigurierte Perioden der gleitenden Durchschnitte
- 100% nicht nachzeichnend
- Verhindert doppelte Signale auf derselben Kerze
- Schreibt bei jeder Kreuzung Nachrichten ins Log (ideal zur Nachverfolgung)
- Sehr leichtgewichtig – funktioniert perfekt auf jedem Zeitrahmen
Meine bevorzugte Anwendung (und die, die ich empfehle):
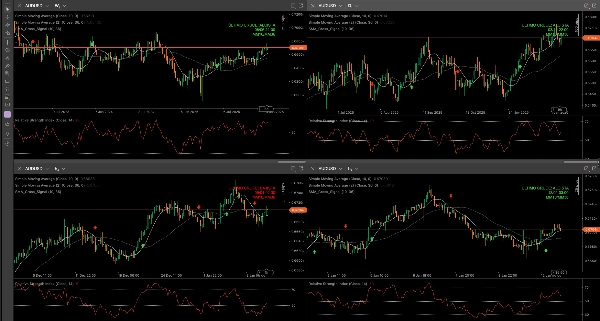
Ich wende ihn gleichzeitig auf den Wochen-, Tages-, H4- und H1-Zeitrahmen desselben Währungspaares an.
Ich nehme hauptsächlich Einstiege im H1-Zeitrahmen, aber der Indikator auf den höheren Zeitrahmen gibt mir eine sehr kraftvolle Gesamtübersicht über die dominierende Richtung des Paares:
- Sind die bullischen/bärischen Kreuzungen auf Wochen- und Tagesbasis ausgerichtet? → Höhere Wahrscheinlichkeit
- Konfliktierende Signale zwischen den Zeitrahmen? → Besser warten oder Positionsgröße reduzieren
Beliebte Konfigurationen, die gut funktionieren:
- 9 / 21
- 10 / 30
- 21 / 50
- 50 / 200 (besonders nützlich auf Wochen- und Tagescharts)
Perfekt sowohl für Anfänger (dank klarer Visualisierung und Einfachheit) als auch für erfahrene Trader, die eine saubere Basis zur Kombination mit Price Action, Unterstützung/Widerstand oder Volumen suchen.
Völlig kostenlos für die gesamte cTrader-Community!
Probieren Sie es im Demo-Modus aus, verwenden Sie es im Multi-Timeframe-Modus, und wenn es Ihnen gefällt… hinterlassen Sie gerne einen Kommentar mit Ihren bevorzugten Einstellungen oder dem Paar, bei dem es für Sie am besten funktioniert 😊
Viel Erfolg beim Trading an alle!
Zusammenfassung
Key features include non-repainting signals, prevention of duplicate alerts on the same bar, and log messages for each crossover event. The indicator is lightweight and compatible with any timeframe, making it suitable for multi-timeframe analysis. Commonly used SMA period pairs include 9/21, 10/30, 21/50, and 50/200, with the latter especially useful on weekly and daily charts.
Traders often apply the indicator simultaneously on weekly, daily, 4-hour, and 1-hour timeframes to gain a comprehensive view of market direction and improve entry timing. It supports various markets including Forex and popular symbols like EURUSD, GBPUSD, USDJPY, XAUUSD, and BTCUSD. The indicator is designed for both beginners and experienced traders seeking clear, straightforward moving average crossover signals.


![„[Hamster-Coder] Pivot Points MTF“-Logo](https://cdn.ctrader.com/image/webp/4c143e5a-309c-40e3-a578-f04d1e133ffa_31159)


![„High-Low Divergence [Iridio Capital]“-Logo](https://cdn.ctrader.com/image/webp/443c4661-7abb-40f1-842f-4b6ec560649b_40914)
