Beschreibung
Dieser ALGORITHMUS ist ein fortschrittliches technisches Werkzeug 🔧, das entwickelt wurde, um die Erkennung von geometrischen Preismustern (Harmonische Muster) und Marktstrukturen basierend auf Preisbewegungen zu automatisieren. Sein Hauptziel ist es, hochwahrscheinliche potenzielle Trendwendezonen 📍 zu identifizieren.
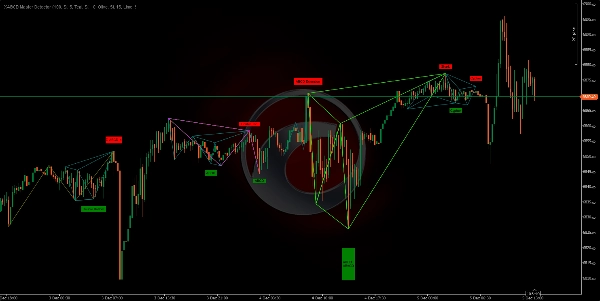
https://chartshots.spotware.com/c/693330cd99c57
Was macht dieser Algorithmus?
Der Algorithmus scannt das Chart in Echtzeit 🔍 und sucht nach spezifischen Preisformationen. Er arbeitet auf zwei Ebenen:
- Strukturabbildung (ZigZag): Zuerst vereinfacht er Marktrauschen, indem er "ZigZag"-Linien zeichnet, die relevante Hoch- und Tiefpunkte (Pivots) verbinden. Er verwendet bis zu 4 verschiedene Längen gleichzeitig 📏, um sowohl kleine (kurzfristige) als auch große (langfristige) Trends zu erfassen.
- Mustererkennung: Sobald diese Pivot-Punkte (Punkte A, B, C, D, X) identifiziert sind, misst der Algorithmus die Abstände und Verhältnisse zwischen ihnen. Wenn diese Verhältnisse den mathematischen Regeln klassischer Handelsmuster (wie Fibonacci) entsprechen, zeichnet der Indikator das Muster und warnt den Benutzer 🚨.
Wozu dient es?
Es dient dazu, Subjektivität zu eliminieren beim Zeichnen komplexer Muster und Analysezeit zu sparen ⏳. Anstatt jede Fibonacci-Retracement- und Erweiterung manuell zu messen, erledigt der Indikator dies automatisch, um:
- Umkehrungen zu erkennen: Punkte zu finden, an denen der Preis drehen könnte (von bullisch zu bärisch oder umgekehrt). 🔄
- Einstiegspunkte zu identifizieren: Präzise Zonen (die "Potenzielle Umkehrzone") zu signalisieren, um in den Markt einzusteigen. 🎯
- Analyse zu bestätigen: Als zusätzliche Übereinstimmung für Ihre eigene Unterstützungs-/Widerstandsstrategie zu dienen.
Logik hinter den Berechnungen
Der Kern des Indikators basiert auf Fibonacci-Verhältnissen und Marktsymmetrie ⚖️. Der Algorithmus überprüft strenge Regeln für jedes Muster. Zum Beispiel berechnet der Algorithmus intern zur Bestätigung eines "Gartley" Musters:
- Ob die Retracement von Punkt B relativ zum Bein XA genau (oder sehr nahe bei) 0,618.
- Ob die Projektion von Punkt D spezifische Proportionen erfüllt.
Der Indikator erlaubt eine kleine Fehlertoleranz (konfigurierbar) da der Markt selten bis auf den genauen Pip perfekt ist. Er berechnet auch das theoretische Risiko-Ertrags-Verhältnis bevor ein Muster angezeigt wird.
Muster, die erkannt werden:
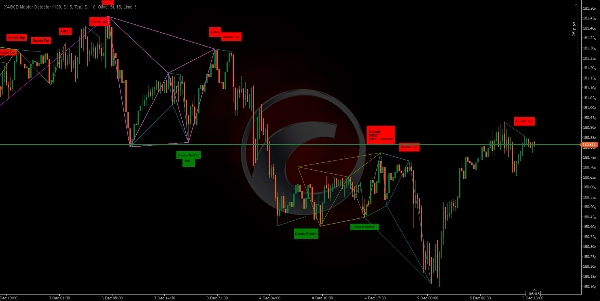
https://chartshots.spotware.com/c/6933314cb9fa1
- Klassiker: Doppel-Top und Doppel-Boden. 🏔️🏞️
- Harmonische Muster: Gartley, Fledermaus 🦇, Schmetterling 🦋, Krabbe 🦀, Tiefe Krabbe, Hai 🦈, Cypher.
- ABCD-Strukturen: Klassisches ABCD, AB=CD, Erweitertes ABCD.
- Exotische Muster: Drei Antriebe, 5-0.
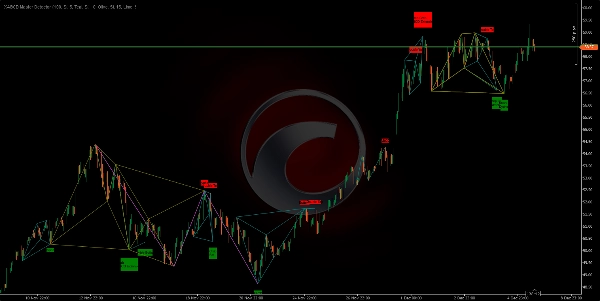
https://chartshots.spotware.com/c/6933317ae4324
Wie benutzt man es?
Visuelle Einrichtung:
- Sie werden farbige Linien sehen, die Gipfel und Täler verbinden.
- Wenn ein Muster vollständig ist, erscheint eine farbige geometrische Figur und ein Label mit dem Musternamen (z.B. "Gartley", "Doppel-Top").
- Grüne Labels: Zeigen bullische Muster an (Suche nach Käufen). 📈
- Rote Labels: Zeigen bärische Muster an (Suche nach Verkäufen). 📉
Interpretation:
- Handeln Sie nicht blind jedes Label. Verwenden Sie es als Warnsignal.
- Wenn ein Muster erscheint, warten Sie, bis der Preis in Zone D reagiert (der letzte Punkt des Musters).
- Suchen Sie nach zusätzlicher Bestätigung (wie eine japanische Umkehrkerze oder RSI-Divergenz), bevor Sie einsteigen.
Wichtige Anpassungen:
- Sie können bestimmte Muster aktivieren oder deaktivieren , wenn Sie nur einige handeln möchten (z.B. nur "Fledermaus" und "Gartley"). ✅
- Sie können die Empfindlichkeit der ZigZags anpassen, um schnellere Bewegungen oder langsamere Trends zu sehen. ⚙️
🏆 Über 10.000 Trader vertrauen auf unsere 25+ Algorithmus-Suite! 🏆
Von Marktstruktur & Liquidität bis intelligente Ausstiegssysteme & prädiktive Werkzeuge - wir haben JEDES Werkzeug gebaut, das Sie für konsistente Ergebnisse benötigen.
👉 Zugriff auf alle 25+ BEWÄHRTEN Systeme:
_______________________________________________
📌 Marktstruktur-Indikatoren
· ✅ AdvancedMarket Structure: Bos, Choch, SwinLevels, Order Blocks, Market Structure& Liquidity Finder
· 🔄 Dynamische Marktstrukturanalyse von Wendepunkten
· 🧱 Order Block
· ⚖️ Marktungleichgewicht
· ⛓️ BOS & CHOCH
· 🧠 ICT Power of 3
_______________________________________________
🔚 Intelligente Ausstiegssysteme
_______________________________________________
📐 ZigZag-Indikatoren
· 🔍 ZigZag Preis-Liquiditätsprojektion
· ➖ ZigZag
_______________________________________________
🧱 Unterstützungs- & Widerstandsindikatoren
· 🟩 SmartTrend Unterstützungs- & Widerstandslinien
· 🧱 Alle Unterstützungs- und Widerstandsebenen
_______________________________________________
📊 Trend- & Kanalindikatoren
· 🔄 Auto-Trend-Kanal
· 📊 Supertrend
· 🔁 Reaktive gleitende Durchschnittslinie
_______________________________________________
💧 Volumen- & Liquiditätswerkzeuge
_______________________________________________
⚡ Momentum- & RSI-Indikatoren
· 🚀 Dynamisches Range Momentum
· 🔎 Multi-Level Candle Bias
Tracker
_______________________________________________
🔮 Prognose- & Projektionswerkzeuge
· 📐 Prognose basierend auf Linreg & ATR
· 📏 Fibonacci Lineare Regression Multi-Timeframe
· 📈 Volumengetriebener Marktfluss-Projektor_________________________
_________________________________________________________________________________________________
_________________________________________________________________________________________________
RSI KANAL TRIGGER: 📶
Was es ist: Ein Indikator, der den RSI(Periode) berechnet und visuell Momentum-Zonen markiert, wenn der RSI die Überkauft-/Überverkauft-Schwellenwerte (Standard 70/30) überschreitet. ✅
https://chartshots.spotware.com/c/69278f8b6d973
Logik: Wenn eine Schwelle überschritten wird, erstellt er eine "Zone" basierend auf dem Hoch/Tief der Kerze zum Zeitpunkt des Überschreitens. Dann: 🧠
- Färbt die Kerzen innerhalb dieser Zone ein.
- Zeichnet einen Kanal (hoch, tief, Mitte).
- Markiert das Überschreiten im RSI-Panel mit einem Kreis und einem Label.
Die Zone dauert genau MinZoneDuration Kerzen. ⏱️
Klare Signale:
- Überschreitung über Überkauft → initiiert eine bullische Zone. 🟢
- Überschreitung unter Überverkauft → initiiert eine bärische Zone. 🔴
Die Zone selbst ist ein Interessensgebiet, keine Order.
https://chartshots.spotware.com/c/69278fb274e0b
Kurzanleitung zur Nutzung:
- Warten Sie, bis die Zone gebildet ist. 🎯
- Bestätigen Sie mit Preisbewegungen (Ausbruch/Ablehnung von den Kanallinien).
- Einstieg mit einem Stop-Loss außerhalb der Zone und einem Ziel an der Mittellinie des Kanals oder einem definierten Risiko-Ertrags-Verhältnis.
https://chartshots.spotware.com/c/69278fe76237b
Wichtige Parameter: ⚙️
- RSI-Periode (14)
- Überkauft (70)
- Überverkauft (30)
- MinZoneDuration (15)
- Konfigurierbare Farben 🎨
Zusammenfassung
The algorithm recognizes classic and complex patterns—including Double Top/Bottom, Gartley, Bat, Butterfly, Crab, Deep Crab, Shark, Cypher, ABCD structures, and exotic patterns like Three Drives and 5-0—by measuring distances and Fibonacci ratios between pivot points. Upon pattern completion, it visually displays colored geometric figures and labels indicating bullish (green) or bearish (red) signals.
Users can customize pattern detection and ZigZag sensitivity to suit their trading preferences. The indicator supports various markets such as Forex, commodities, indices, stocks, and cryptocurrencies, including symbols like EURUSD, GBPUSD, BTCUSD, XAUUSD, NAS100, and USDJPY.
XABCD Master Detector aims to reduce subjectivity and save analysis time by automatically calculating Fibonacci retracements, extensions, and theoretical risk/reward ratios. It serves as an alert tool to detect reversals, identify entry points, and provide additional confluence to existing support/resistance strategies.
Kundenbewertungen
5 | 100 % | |
4 | 0 % | |
3 | 0 % | |
2 | 0 % | |
1 | 0 % |