
Descrizione
PANORAMICA
L'Analisi del Volume Spread (VSA) è una metodologia sviluppata da Tom Williams, un ex trader di sindacato, basata sul lavoro di Richard Wyckoff dei primi anni del 1900. VSA interpreta la relazione tra volume, spread di prezzo (range) e posizione di chiusura per identificare squilibri tra domanda e offerta.
Concetti chiave di VSA:
- Volume mostra la quantità di attività - chi partecipa
- Spread mostra volatilità e incertezza - quanto si è mosso il prezzo
- Posizione di Chiusura mostra chi ha vinto la barra - acquirenti o venditori
- Contesto mostra dove siamo nel ciclo di mercato - fase di forza o debolezza
Quando il volume aumenta con uno spread ampio ma poco progresso del prezzo, suggerisce assorbimento (un lato che assorbe la pressione dell'altro). Quando il volume diminuisce con uno spread stretto in una tendenza, suggerisce mancanza di partecipazione (potenziale debolezza).
Questa Implementazione:
Questo indicatore quantifica i concetti di VSA utilizzando metodi statistici. Differisce dal VSA tradizionale in diversi modi:
- Utilizza
(close - open) / rangecome metrica di efficienza (non presente nel VSA originale) - I modelli di assorbimento identificano "un lato che vince" piuttosto che il tradizionale "assorbimento della pressione"
- ENR (Effort No Result) è quantificato usando una soglia di efficienza; il VSA originale è più interpretativo
- Utilizza la media troncata per la media del volume (resistente agli outlier) e la classificazione percentuale per lo spread
- Non include: Volume di Stop, Upthrust, Test, modelli Shakeout
Questo è un approccio quantificato e algoritmico ai concetti di VSA. Il VSA tradizionale è più interpretativo e dipendente dal contesto. Usa questo indicatore come uno strumento analitico tra molti, non come segnali autonomi.
COSA FA QUESTO INDICATORE
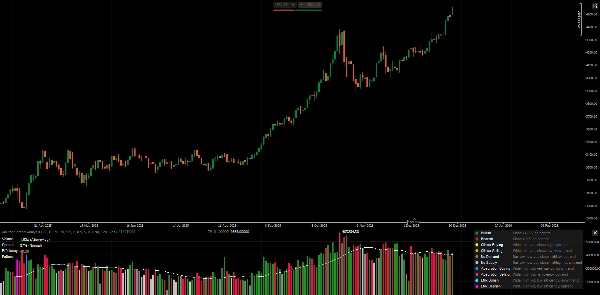
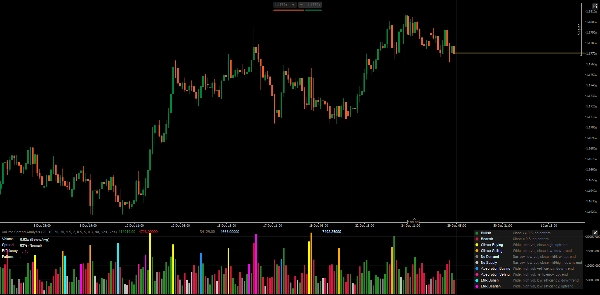
Analizza il volume, lo spread e la posizione di chiusura di ogni barra per rilevare potenziali squilibri tra domanda e offerta. Visualizza un istogramma del volume colorato in base al tipo di modello, con un pannello metriche in tempo reale.
DEFINIZIONI DEI MODELLI
1. Barre Standard (Nessun Modello)
- Rialzista: Chiusura ≥ 0,5 nel range, nessun modello speciale rilevato
- Ribassista: Chiusura < 0,5 nel range, nessun modello speciale rilevato
2. Modelli Climax (Potenziale Esaurimento)
- Climax di Acquisto: Spread ampio + volume ultra-alto + chiusura alta + in tendenza rialzista
-
- Interpretazione: Possibile esaurimento degli acquisti, attenzione al ribaltamento
- Climax di Vendita: Spread ampio + volume ultra-alto + chiusura bassa + in tendenza ribassista
-
- Interpretazione: Possibile esaurimento delle vendite, attenzione al ribaltamento
3. Modelli Deboli (Mancanza di Convizione)
- Nessuna Domanda: Spread stretto + volume basso + chiusura media/bassa + in tendenza rialzista
-
- Interpretazione: Gli acquirenti non supportano il rally, potenziale debolezza
- Nessuna Offerta: Spread stretto + volume basso + chiusura media/alta + in tendenza ribassista
-
- Interpretazione: I venditori non spingono al ribasso, potenziale forza
4. Modelli di Assorbimento (Un Lato Vince)
- Assorbimento Acquisto: Spread ampio + volume alto + efficienza positiva + in tendenza ribassista
-
- Interpretazione: Gli acquirenti assorbono la pressione di vendita, potenziale inversione al rialzo
- Assorbimento Vendita: Spread ampio + volume alto + efficienza negativa + in tendenza rialzista
-
- Interpretazione: I venditori assorbono la pressione di acquisto, potenziale inversione al ribasso
5. Modelli ENR (Sforzo Senza Risultato Chiaro)
- ENR Rialzista: Spread ampio + volume alto + bassa efficienza + in tendenza ribassista
-
- Interpretazione: Alto sforzo ma nessun vincitore chiaro, potenziale supporto/indecisione
- ENR Ribassista: Spread ampio + volume alto + bassa efficienza + in tendenza rialzista
-
- Interpretazione: Alto sforzo ma nessun vincitore chiaro, potenziale resistenza/indecisione
PANNELLO METRICHE SPIEGATO
Volume
- Mostra il volume della barra corrente come rapporto rispetto alla media troncata (es. "1,85x")
- Classificazione: Basso / SottoMedia / SopraMedia / Alto / UltraAlto
- Volume alto = partecipazione al mercato, ma il contesto è importante
Spread
- Mostra la posizione percentuale (0-100%) rispetto alle barre recenti
- Classificazione: Stretto / Normale / Ampio
- Spread ampio = volatilità/incertezza, non necessariamente direzione
Efficienza
- Formula:
(close - open) / (high - low) - Intervallo: -1,0 a +1,0
- Positivo = corpo rialzista domina il range
- Negativo = corpo ribassista domina il range
- Vicino a zero = corpo piccolo, ombra alta, indecisione
Modello
- Modello attualmente rilevato (o "-" se nessuno)
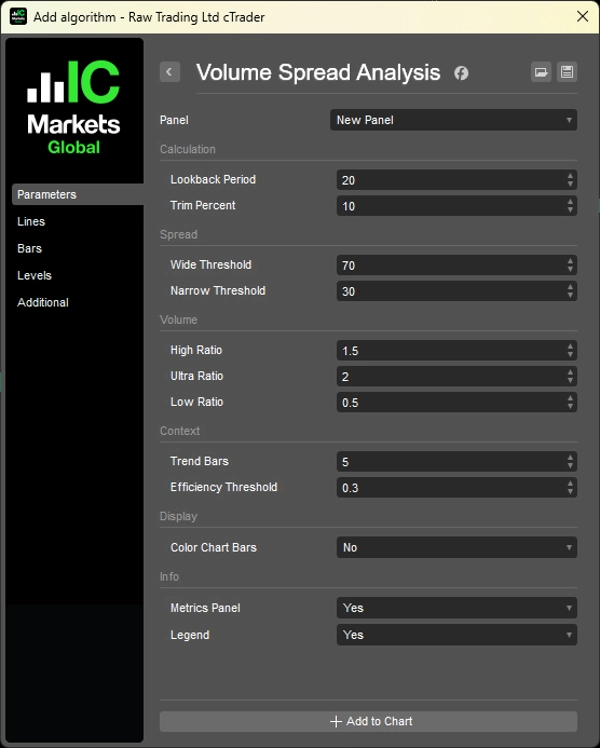
PARAMETRI
1. Calcolo
- Periodo di Riferimento (20): Barre usate per le statistiche di volume/spread
- Percentuale di Troncamento (10%): Rimuove gli outlier dal calcolo del volume
2. Classificazione Spread
- Soglia Ampia (70%): Percentile per classificare come "ampio"
- Soglia Stretta (30%): Percentile per classificare come "stretto"
3. Classificazione Volume
- Rapporto Alto (1,5x): Soglia sopra la media
- Rapporto Ultra (2,0x): Soglia ultra-alta
- Rapporto Basso (0,5x): Soglia sotto la media
4. Contesto
- Barre di Tendenza (5): Barre precedenti per confrontare la direzione della tendenza
- Soglia di Efficienza (0,3): Minimo per efficienza "forte"
5. Visualizzazione
- Colora le Barre del Grafico: Applica i colori dei modelli al grafico dei prezzi
- Pannello Metriche: Mostra metriche in tempo reale
- Legenda: Mostra la guida di riferimento dei modelli
COME USARE
1. Non usare i modelli come segnali di trading diretti - indicano potenziale contesto, non ingressi.
2. Combina con la struttura dei prezzi - VSA funziona meglio confermando ciò che mostra la struttura dei prezzi.
3. Osserva il contesto - lo stesso modello può significare cose diverse a supporto rispetto alla resistenza.
4. La prospettiva del volume è importante - assorbimento di volume alto a livello chiave > assorbimento casuale di barre.
Limitazione del Volume Forex
Il mercato spot Forex mostra volume tick (numero di variazioni di prezzo), non i contratti effettivamente scambiati. I modelli possono essere meno affidabili rispetto a futures/azioni con dati di volume reali.
LEGENDA (Riferimento Integrato)
Abilita il parametro "Legenda" per visualizzare le descrizioni dei modelli direttamente sul grafico.
__________________________________________________________________________________________
ALTRI INDICATORI GRATUITI
Esplora una vasta gamma di strumenti di analisi di mercato—dalla struttura e volume alla regressione, volatilità e timeframe personalizzati.
Il codice sorgente è disponibile nel repository GitHub.
Tutti gratuiti da usare. Ma se vuoi offrire un supporto per un caffè, puoi farlo qui.
Supporto/Resistenza
Volume
- Volume Activity Profiler
- Volume Efficiency Analyzer
- Volume Profile Analytics
- Volume Profile - Aggiornato
- Volume Spread Analysis
- VWAP (Prezzo Medio Ponderato per Volume)
Medie Mobili
- SSL Channel
- Media Mobile Ancorata
- Media Mobile Scaled per Deviazione
- Gann High Low Activator
- Linea di Tendenza Istantanea
- Media Mobile Adattiva Kaufman con Trend Vision
- Canale Media Mobile
- Suite Medie Mobili
- Media Mobile Canale di Tendenza
Utility/Personalizzati
Basati su Regressione
Volatilità
Oscillatori
__________________________________________________________________________________________
DICHIARAZIONE DI RESPONSABILITÀ
Il trading comporta rischi. Questo indicatore è destinato solo all'analisi tecnica — applica sempre una gestione del rischio adeguata e fai trading responsabilmente.
FEEDBACK E MIGLIORAMENTI
Se hai suggerimenti, richieste di funzionalità o idee per miglioramenti, lascia un commento nella scheda Discussione. Il tuo feedback aiuta a migliorare l'indicatore per tutti.
Riepilogo
This implementation quantifies VSA concepts using statistical methods, including an efficiency metric defined as (close - open) / range, trimmed mean volume averaging, and percentile ranking for spread. It identifies several bar patterns: Standard (bullish/bearish), Climax (buying/selling exhaustion), Weak (No Demand/No Supply), Absorption (one side winning), and ENR (Effort No Result), each indicating different market conditions.
The indicator displays a volume histogram colored by detected pattern type and provides a real-time metrics panel showing volume ratio, spread percentile, efficiency, and current pattern. Parameters allow customization of lookback periods, volume/spread thresholds, and display options such as coloring chart bars and showing a pattern legend.
VSA is applicable across markets including Forex, stocks, indices, commodities, and crypto. Note that Forex volume reflects tick volume, which may affect pattern reliability. The indicator is designed as an analytical tool to complement price structure analysis rather than as standalone trade signals.
Recensioni dei clienti
5 | 100 % | |
4 | 0 % | |
3 | 0 % | |
2 | 0 % | |
1 | 0 % |


