คำอธิบาย
ภาพรวม
พื้นฐาน: หลักการ Wyckoff
ตัวบ่งชี้นี้สร้างขึ้นบนแนวคิดเสริมสองประการจากวิธีการของ Wyckoff:
1. ความพยายามเทียบกับผลลัพธ์
หลักการสำคัญของ Wyckoff ระบุว่าการเคลื่อนไหวของราคา (ผลลัพธ์) ควรสัดส่วนกับปริมาณเบื้องหลัง (ความพยายาม) เมื่อความพยายามและผลลัพธ์สอดคล้องกัน ตลาดจะทำงานตามปกติ เมื่อทั้งสองแยกจากกัน จะเป็นสัญญาณของจุดกลับตัวหรือความแข็งแกร่งของการดำเนินต่อไป
ตัวบ่งชี้นี้นำไปใช้โดยตรงผ่าน ประสิทธิภาพ (ผลลัพธ์ต่อหน่วยความพยายาม) และค่ากลับกันของมัน, การดูดซับ (ความพยายามที่ไม่แปลงเป็นผลลัพธ์).
2. การวิเคราะห์ช่วงราคา
Wyckoff ยังเน้นการวิเคราะห์ลักษณะของแท่งราคาทีละแท่ง—การตรวจสอบช่วงราคา (ช่วง), ตำแหน่งที่ราคาปิดภายในช่วงนั้น และว่าแท่งนั้นแสดงความมุ่งมั่นหรือความลังเล.
ตัวบ่งชี้นี้นำการวิเคราะห์ช่วงราคามาใช้ผ่าน ความมั่นใจ (ความมุ่งมั่นในทิศทาง), อัตราส่วนที่สูญเปล่า (การถอยกลับภายในแท่ง), และ ตำแหน่งปิด (ใช้เพื่อให้บริบทกับการดูดซับว่าเป็นการสะสมหรือการกระจาย).
สิ่งที่ตัวบ่งชี้นี้ทำ
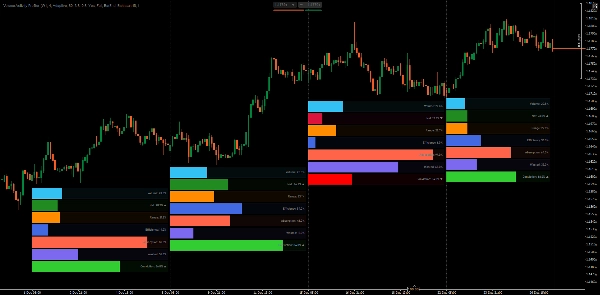
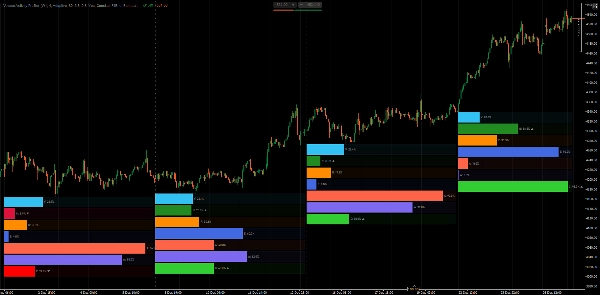
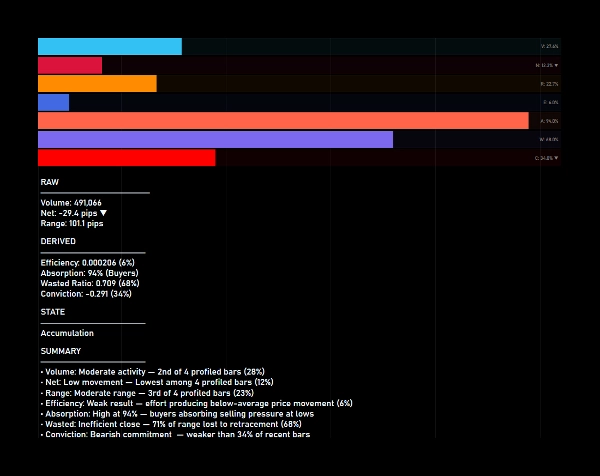
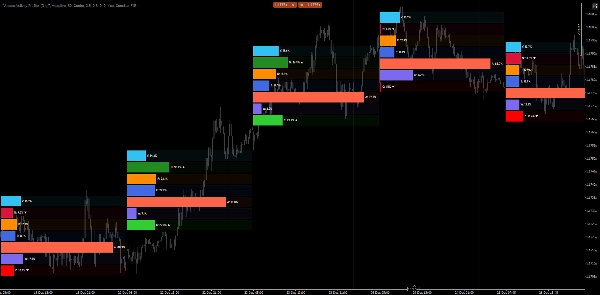
Volume Activity Profiler วิเคราะห์แท่งราคาจากกรอบเวลาที่เลือกและแยกกิจกรรมของพวกมันออกเป็นส่วนประกอบที่วัดได้ มันคำนวณทั้งเมตริกดิบและเมตริกที่ได้จากเปอร์เซ็นไทล์ จากนั้นแสดงเป็นกราฟแท่งแนวนอนที่ยึดอยู่ใต้แท่งที่วิเคราะห์แต่ละแท่ง
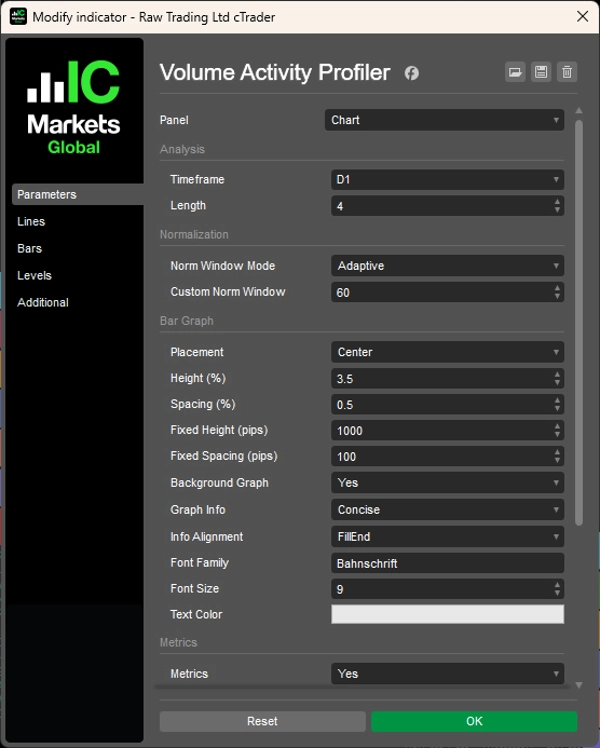
คุณตั้งค่าพารามิเตอร์หลักสองอย่าง:
- กรอบเวลา: กรอบเวลาที่จะวิเคราะห์ (เช่น รายสัปดาห์ รายวัน H4)
- ความยาว: จำนวนแท่งที่จะวิเคราะห์ (เช่น 4 แท่งล่าสุด)
ตัวบ่งชี้จะวิเคราะห์แต่ละแท่งในขอบเขตนั้น คำนวณเมตริกและจัดอันดับพวกมันเทียบกับกันและกับมาตรฐานในอดีต
คำอธิบายเมตริก
เมตริกดิบ (อิงสัดส่วนระหว่างแท่งที่วิเคราะห์):
1. ปริมาณ
ปริมาณการเคลื่อนไหวของแท่ง แสดงสัดส่วนของปริมาณรวมที่แท่งนี้เป็นตัวแทน
2. สุทธิ
การเคลื่อนไหวในทิศทาง (ราคาปิด − ราคาเปิด) เป็นพิปส์ แสดงสัดส่วนของการเคลื่อนไหวสุทธิรวม สีแสดงทิศทาง (เขียว = ขาขึ้น แดง = ขาลง)
3. ช่วง
ช่วงราคาทั้งหมด (สูง − ต่ำ) เป็นพิปส์ แสดงสัดส่วนของช่วงรวมในแท่งที่วิเคราะห์
เมตริกที่ได้จากการคำนวณ (อิงเปอร์เซ็นไทล์เทียบกับหน้าต่างประวัติศาสตร์):
1. ประสิทธิภาพ (ความพยายามเทียบกับผลลัพธ์)
ช่วงที่เกิดขึ้นต่อหน่วยปริมาณ ประสิทธิภาพสูงหมายถึงความพยายามแปลงเป็นการเคลื่อนไหวของราคา ประสิทธิภาพต่ำบ่งชี้การดูดซับหรือแรงต้าน
2. การดูดซับ (ความพยายามเทียบกับผลลัพธ์)
ค่ากลับของประสิทธิภาพ การดูดซับสูงบ่งชี้ว่าปริมาณถูกดูดซับโดยไม่มีการเคลื่อนไหวของราคาสัดส่วน—อาจเป็นการสะสมหรือการกระจาย
3. การสูญเปล่า (การวิเคราะห์ช่วงราคา)
เปอร์เซ็นต์ของช่วงที่สูญเสียไปกับการถอยกลับ (ช่วง − สุทธิ) / ช่วง การสูญเปล่าสูงหมายถึงแท่งคืนการเคลื่อนไหวมากมาย การสูญเปล่าต่ำบ่งชี้แท่งที่ชัดเจนและมีทิศทาง
4. ความมั่นใจ (การวิเคราะห์ช่วงราคา)
ความมุ่งมั่นในทิศทางวัดเป็นสุทธิ/ช่วง ความมั่นใจสูงหมายถึงแท่งปิดใกล้จุดสุดขีด ความมั่นใจต่ำบ่งชี้ความลังเลหรือการปฏิเสธ
การเข้าใจกราฟแท่ง
แท่งที่วิเคราะห์แต่ละแท่งแสดงแท่งแนวนอน 7 แท่ง:
- ปริมาณ, สุทธิ, ช่วง — เติมตามสัดส่วนระหว่างแท่งที่วิเคราะห์
- ประสิทธิภาพ, การดูดซับ, การสูญเปล่า, ความมั่นใจ — เติมตามอันดับเปอร์เซ็นไทล์เทียบกับข้อมูลประวัติ
แท่งที่เติมถึง 80% ในประสิทธิภาพหมายความว่าประสิทธิภาพของแท่งนี้สูงกว่า 80% ของแท่งในหน้าต่างการปรับมาตรฐาน
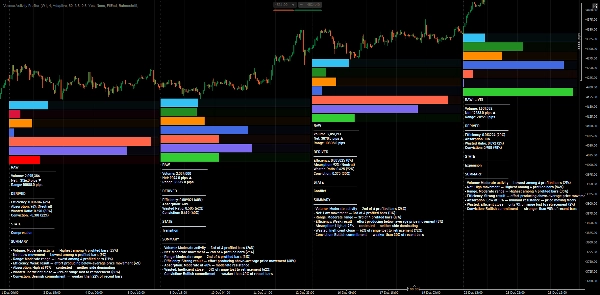
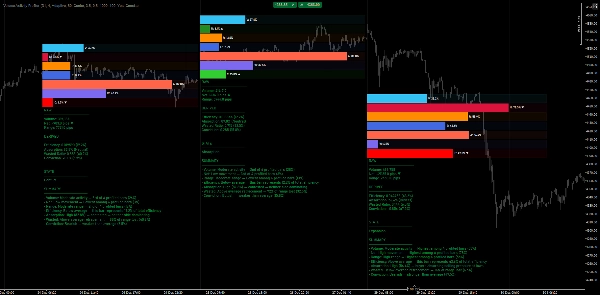
การจำแนกสถานะกิจกรรม
เมื่อเปิดแสดงเมตริก ตัวบ่งชี้จะแบ่งแท่งแต่ละแท่งเป็นหนึ่งในสถานะเหล่านี้:
1. การบีบอัด
ประสิทธิภาพต่ำ + ความมั่นใจต่ำ — ราคากำลังขดตัว พลังงานสะสม
2. การขยายตัว
ประสิทธิภาพสูง + ความมั่นใจสูง + การสูญเปล่าต่ำ — การเคลื่อนไหวที่มีทิศทางแข็งแรง
3. ความขัดแย้ง
การสูญเปล่าสูง + ความมั่นใจต่ำ — การต่อสู้ระหว่างผู้ซื้อและผู้ขาย
4. การสะสม
การดูดซับสูง + ปิดใกล้ต่ำ — ผู้ซื้อกำลังดูดซับแรงกดดันจากการขาย
5. การกระจาย
การดูดซับสูง + ปิดใกล้สูง — ผู้ขายกำลังดูดซับแรงกดดันจากการซื้อ
6. การปฏิเสธ
ความมั่นใจสูงแต่ปิดตรงข้ามกับทิศทาง — การเคลื่อนไหวล้มเหลว อาจเกิดการกลับตัว
7. การเปลี่ยนผ่าน
สัญญาณผสม — ตลาดอยู่ในช่วงเปลี่ยนผ่านระหว่างสถานะ
ประโยชน์เชิงปฏิบัติ
- การประเมินความพยายามเทียบกับผลลัพธ์อย่างรวดเร็ว — เห็นได้ทันทีว่าปริมาณกำลังสร้างการเคลื่อนไหวที่สัดส่วนหรือถูกดูดซับ
- การวิเคราะห์โครงสร้างหลายกรอบเวลา — วิเคราะห์แท่งกรอบเวลาที่สูงกว่าในขณะที่ยังคงอยู่ในกรอบเวลาการดำเนินการของคุณ
- ระบุการสะสม/การกระจาย — การดูดซับสูงพร้อมตำแหน่งปิดเผยว่าผู้เล่นรายใหญ่กำลังทำงานอยู่ที่ใด
- สังเกตความเหนื่อยล้าและการปฏิเสธ — ความมั่นใจสูงพร้อมตำแหน่งปิดตรงข้ามเตือนถึงการกลับตัวที่อาจเกิดขึ้น
- เปรียบเทียบแท่งอย่างเป็นกลาง — การจัดอันดับและเปอร์เซ็นไทล์ช่วยลดความลำเอียงจากการประเมินปริมาณ "สูง" หรือ "ต่ำ"
- ยืนยันการเบรคเอาท์ — สถานะการขยายตัวพร้อมประสิทธิภาพและความมั่นใจสูงยืนยันความสนใจในการเบรคเอาท์ที่แท้จริง
ปริมาณทิกเป็นตัวแทนความพยายาม
ตัวบ่งชี้นี้ใช้ปริมาณทิกเป็นข้อมูลความพยายาม ในฟอเร็กซ์ ปริมาณทิกแสดงความถี่การเปลี่ยนแปลงราคาแทนปริมาณการซื้อขายจริง—ซึ่งเป็นข้อจำกัดที่รู้จักของตลาดแบบกระจายศูนย์
แม้จะมีข้อจำกัดนี้ ปริมาณทิกก็ทำหน้าที่เป็นตัวแทนความพยายามได้อย่างมีประสิทธิภาพเพราะ:
- มันสะท้อนกิจกรรมตลาดสัมพัทธ์ระหว่างแท่ง
- จำนวนทิกสูงบ่งชี้การมีส่วนร่วมของผู้เข้าร่วมที่เพิ่มขึ้น
- ความสัมพันธ์ความพยายามเทียบกับผลลัพธ์ยังคงอยู่—กิจกรรมสูงที่สร้างการเคลื่อนไหวเล็กน้อยยังบ่งชี้การดูดซับ
การจัดอันดับเปอร์เซ็นไทล์และการเปรียบเทียบแท่งของตัวบ่งชี้ยังคงถูกต้องตราบใดที่ข้อมูลมีความสม่ำเสมอ
หมายเหตุ
- ตัวบ่งชี้ใช้หน้าต่างการปรับมาตรฐานแบบปรับตัวตามกรอบเวลาเมื่อถูกตั้งค่าเป็นโหมด Adaptive เพื่อให้บริบทประวัติศาสตร์ที่เกี่ยวข้อง
- การคำนวณเปอร์เซ็นไทล์จะอัปเดตเฉพาะบนแท่งที่เสร็จสมบูรณ์เพื่อหลีกเลี่ยงการอ่านค่าที่ไม่เสถียรบนแท่งที่กำลังสร้าง
- แท่งที่กำลังสร้างปัจจุบันจะถูกทำเครื่องหมายด้วย [LIVE] ในแผงเมตริก
__________________________________________________________________________________________
ตัวบ่งชี้ฟรีเพิ่มเติม
สำรวจเครื่องมือวิเคราะห์ตลาดหลากหลายประเภท—ตั้งแต่โครงสร้างและปริมาณไปจนถึงการถดถอย ความผันผวน และกรอบเวลาที่กำหนดเอง
ซอร์สโค้ดมีให้บน GitHub repository.
ทั้งหมดใช้ฟรี แต่ถ้าคุณต้องการสนับสนุนด้วยกาแฟ คุณสามารถส่งได้ ที่นี่.
แนวรับ/แนวต้าน
ปริมาณ
- Volume Activity Profiler
- Volume Efficiency Analyzer
- Volume Profile Analytics
- Volume Profile - Updated
- Volume Spread Analysis
- VWAP (ราคาเฉลี่ยถ่วงน้ำหนักด้วยปริมาณ)
ค่าเฉลี่ยเคลื่อนที่
- ช่อง SSL
- ค่าเฉลี่ยเคลื่อนที่ยึดจุด
- ค่าเฉลี่ยเคลื่อนที่ปรับสเกลเบี่ยงเบน
- ตัวกระตุ้น Gann High Low
- เส้นแนวโน้มทันที
- Kaufman Adaptive MA พร้อม Trend Vision
- ช่องค่าเฉลี่ยเคลื่อนที่
- ชุดค่าเฉลี่ยเคลื่อนที่
- ค่าเฉลี่ยเคลื่อนที่ช่องแนวโน้ม
ยูทิลิตี้/กำหนดเอง
อิงการถดถอย
ความผันผวน
ออสซิลเลเตอร์
__________________________________________________________________________________________
ข้อจำกัดความรับผิดชอบ
การซื้อขายมีความเสี่ยง ตัวบ่งชี้นี้มีไว้สำหรับการวิเคราะห์ทางเทคนิคเท่านั้น — โปรดใช้การจัดการความเสี่ยงที่เหมาะสมและซื้อขายอย่างรับผิดชอบเสมอ
ข้อเสนอแนะ & การปรับปรุง
หากคุณมีข้อเสนอแนะ คำขอฟีเจอร์ หรือไอเดียสำหรับการปรับปรุง กรุณาแสดงความคิดเห็นในแท็บ Discussion ข้อเสนอแนะของคุณช่วยปรับปรุงตัวบ่งชี้สำหรับทุกคน
สรุป
The indicator profiles price bars over a user-selected timeframe and length, calculating raw metrics such as Volume (tick volume proportion), Net (directional price movement), and Range (price range). It also derives percentile-based metrics including Efficiency (price movement per volume unit), Absorption (volume without proportional price change), Wasted Ratio (retracement within the bar), and Conviction (directional commitment).
These metrics are visually represented as horizontal bar graphs beneath each analyzed bar, facilitating objective comparison and historical context. The indicator classifies bars into activity states like Compression, Expansion, Conflict, Accumulation, Distribution, Rejection, and Transition, aiding in identifying market phases and potential turning points.
Volume Activity Profiler uses tick volume as an effort proxy, reflecting relative market activity. It supports multi-timeframe analysis and updates percentile rankings on completed bars to ensure stable readings. This tool assists traders in assessing volume efficiency, spotting accumulation/distribution, confirming breakouts, and understanding market structure through quantitative volume and price bar analysis.
รีวิวจากลูกค้า
5 | 100 % | |
4 | 0 % | |
3 | 0 % | |
2 | 0 % | |
1 | 0 % |