
คำอธิบาย
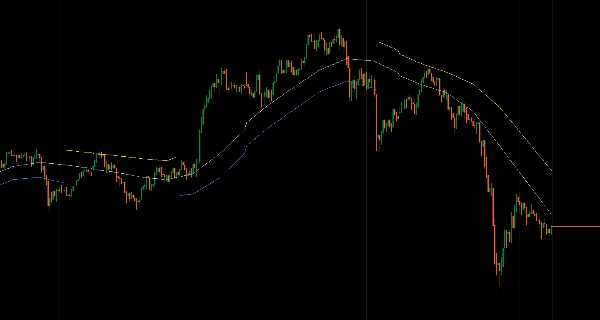
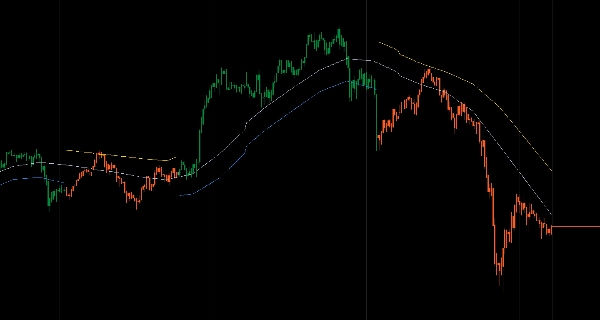
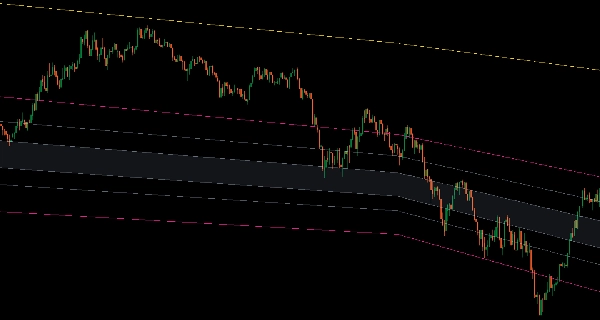
ระบบช่องสัญญาณปรับตัวสามสีโดยใช้ค่าเฉลี่ยเคลื่อนที่บนราคาทั้งสี่ OHLC สำหรับการวิเคราะห์ทิศทางแนวโน้มและโครงสร้าง
แสดงขอบเขตสูง/ต่ำ เส้นแนวโน้มเปิด/ปิด และสมดุลกลางด้วยสถานะแนวโน้มที่มีรหัสสี (สีน้ำเงินแนวโน้มขาขึ้น สีทองแนวโน้มขาลง สีเทาเป็นกลาง) ที่ปรับตัวพร้อมกัน
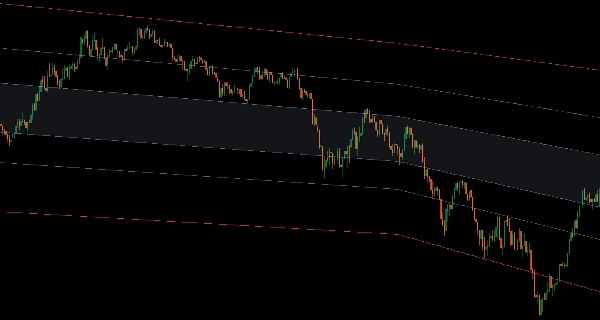
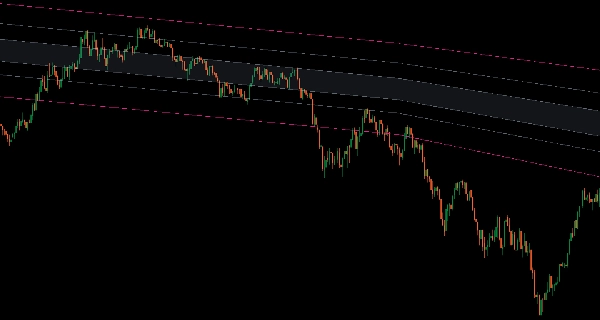
สองโหมดการแสดงผล (ช่องสัญญาณเต็มรูปแบบหรือการลดความยุ่งเหยิงตามแนวโน้ม) หกโซนฟีโบนักชีที่เลือกได้ (การถอยกลับช่องสัญญาณเต็มรูปแบบ ระดับครึ่งช่อง ขยายการเบรคเอาท์) 15 อัลกอริทึมค่าเฉลี่ยเคลื่อนที่ (Arnaud Legoux, Jurik, Hull, KAMA, VIDYA, Deviation Scaled, SuperSmoother, Ultimate Smoother, McGinley Dynamic, T3, ZLEMA, Laguerre) การแทรกแซงหลายกรอบเวลา การคำนวณวันที่ยึดสำหรับช่วงเวลาการเติบโตตามเหตุการณ์ และการระบายสีแท่งตามแนวโน้ม มอบโครงสร้างช่องสัญญาณที่สอดคล้องกันสำหรับผู้ค้าที่ยึดเป้าหมายการดึงกลับและการกลับสู่ค่าเฉลี่ยภายในขอบเขตที่กำหนด
คุณสมบัติ
ระบบแนวโน้มสามสี
- เส้นสีน้ำเงิน: ยืนยันแนวโน้มขาขึ้น—เทรดการดึงกลับไปยังเส้นต่ำ
- เส้นสีทอง: ยืนยันแนวโน้มขาลง—เทรดการเด้งกลับไปยังเส้นสูง
- เส้นสีเทา: เป็นกลาง/เคลื่อนไหวในกรอบ—หลีกเลี่ยงจุดสุดขีด, เก็บกำไรที่กลาง
- เส้นทั้งหมดปรับตัวพร้อมกัน—ไม่มีสัญญาณผสม
โครงสร้างช่องสัญญาณครบถ้วน
- เส้นสูง/ต่ำกำหนดขอบเขตช่องสัญญาณ
- เส้นเปิด/ปิดแสดงแนวโน้มทิศทางภายในช่องสัญญาณ
- เส้นกลาง (ศูนย์กลางของทั้งสี่) แสดงสมดุลที่แท้จริง
- โครงสร้างบูรณาการที่เคลื่อนไหวอย่างสอดคล้องกัน
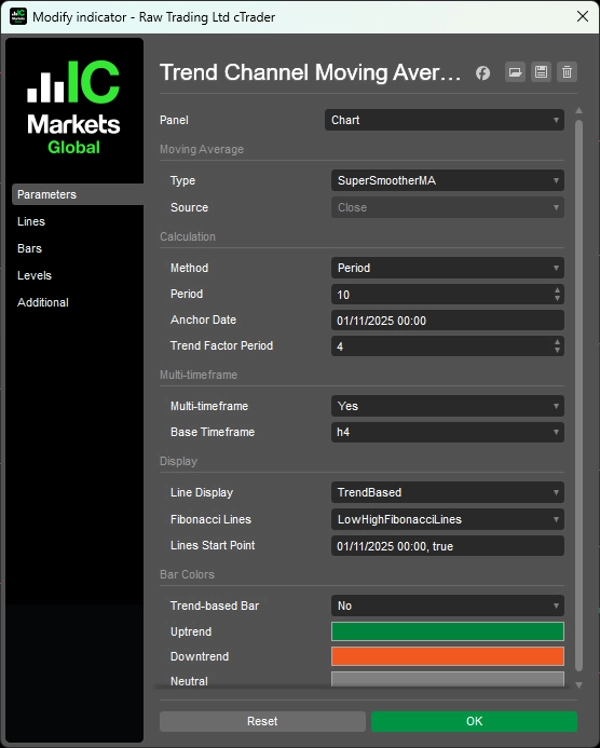
สองโหมดการแสดงผล
- โหมดช่องสัญญาณ: แสดงขอบเขตทั้งสองเสมอพร้อมสีแนวโน้ม
- โหมดตามแนวโน้ม: ซ่อนเส้นสูงในแนวโน้มขาขึ้น, เส้นต่ำในแนวโน้มขาลง—ลดความยุ่งเหยิงทางสายตา, รักษาโฟกัสที่ขอบเขตที่เทรดได้
6 โซนฟีโบนักชี (เลือกได้)
- ระหว่างต่ำ-สูง (การถอยกลับช่องสัญญาณเต็ม)
- ระหว่างต่ำ-กลาง หรือ กลาง-สูง (ระดับครึ่งช่อง)
- การขยายบน/ล่าง (เป้าหมายเบรคเอาท์)
- ช่วงรวม (จากการขยายล่างถึงบน)
15 ประเภทค่าเฉลี่ยเคลื่อนที่
- อัลกอริทึมมืออาชีพ: Arnaud Legoux, Jurik, Hull, KAMA, VIDYA, Deviation Scaled, SuperSmoother, Ultimate Smoother, McGinley Dynamic, T3, ZLEMA, Laguerre
- สัญญาณที่ชัดเจน ปรับแต่งเพื่อการระบุแนวโน้ม
ฟังก์ชันขั้นสูง
- โหมดหลายกรอบเวลากับการแทรกแซงที่ราบรื่น
- การคำนวณวันที่ยึด (ช่วงเวลาการเติบโตจากเหตุการณ์/ระดับเฉพาะ)
- การระบายสีแท่งตามแนวโน้ม (เลือกได้)
- การควบคุมจุดเริ่มต้นของเส้น (ซ่อนข้อมูลประวัติศาสตร์, แสดงเฉพาะโครงสร้างล่าสุด)
__________________________________________________________________________________________
ตัวชี้วัดฟรีเพิ่มเติม
สำรวจเครื่องมือวิเคราะห์ตลาดหลากหลายประเภท—ตั้งแต่โครงสร้างและปริมาณไปจนถึงการถดถอย ความผันผวน และกรอบเวลาที่กำหนดเอง
ซอร์สโค้ดมีให้บน GitHub repository.
ทั้งหมดใช้ฟรี แต่ถ้าคุณต้องการสนับสนุนด้วยกาแฟ คุณสามารถส่งได้ ที่นี่.
แนวรับ/แนวต้าน
ปริมาณ
- Volume Activity Profiler
- Volume Efficiency Analyzer
- Volume Profile Analytics
- Volume Profile - Updated
- Volume Spread Analysis
- VWAP (Volume Weighted Average Price)
ค่าเฉลี่ยเคลื่อนที่
- SSL Channel
- Anchored Moving Average
- Deviation-Scaled Moving Average
- Gann High Low Activator
- Instantaneous Trendline
- Kaufman Adaptive MA with Trend Vision
- Moving Average Channel
- Moving Averages Suite
- Trend Channel Moving Average
ยูทิลิตี้/กำหนดเอง
แบบถดถอย
ความผันผวน
ออสซิลเลเตอร์
__________________________________________________________________________________________
ข้อจำกัดความรับผิดชอบ
การเทรดมีความเสี่ยง ตัวชี้วัดนี้มีไว้สำหรับการวิเคราะห์ทางเทคนิคเท่านั้น — โปรดใช้การบริหารความเสี่ยงอย่างเหมาะสมและเทรดอย่างรับผิดชอบเสมอ
ข้อเสนอแนะ & การปรับปรุง
หากคุณมีข้อเสนอแนะ คำขอคุณสมบัติ หรือไอเดียสำหรับการปรับปรุง โปรดแสดงความคิดเห็นในแท็บ Discussion ข้อเสนอแนะของคุณช่วยปรับปรุงตัวชี้วัดสำหรับทุกคน
สรุป
Key features include two display modes—full channel and trend-based clutter reduction—and six optional Fibonacci zones covering full and half-channel retracements plus breakout extensions. The system supports 15 professional moving average algorithms such as Arnaud Legoux, Jurik, Hull, KAMA, VIDYA, and others, optimized for clean trend identification. Additional functionalities include multi-timeframe interpolation, anchor date calculation for event-based periods, trend-based bar coloring, and control over line start points to focus on recent data.
This indicator is designed to help traders identify pullbacks and mean reversion opportunities within defined channel boundaries, enhancing decision-making in various market conditions.
รีวิวจากลูกค้า
5 | 100 % | |
4 | 0 % | |
3 | 0 % | |
2 | 0 % | |
1 | 0 % |


!["[Hamster-Coder] Pivot Points MTF" โลโก้](https://cdn.ctrader.com/image/webp/4c143e5a-309c-40e3-a578-f04d1e133ffa_31159)