
Sero
อินดิเคเตอร์
104 ดาวน์โหลด
เวอร์ชัน 1.0, Mar 2026
Windows, Mac
คำอธิบาย
Sero — ตัวแกว่งโมเมนตัม
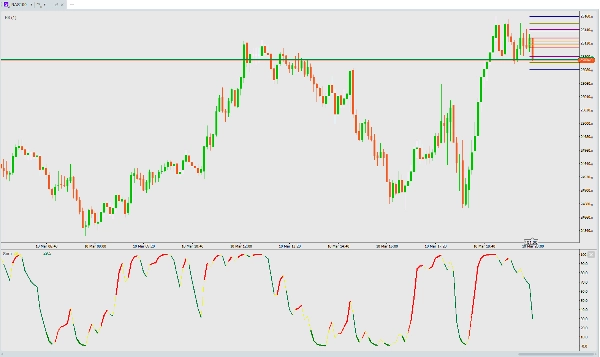
Sero เป็นตัวแกว่งโมเมนตัมที่อิงจากสโตแคสติก ซึ่งให้สัญญาณภาพที่ชัดเจนและมีการใช้สีเพื่อบ่งบอกการเปลี่ยนแปลงของโมเมนตัมตลาด
วิธีการทำงาน
Sero คำนวณค่าสต็อกแคสติกที่ผ่านการปรับค่าเรียบจากราคาทั่วไป (สูง+ต่ำ+ปิด)/3 ในช่วง 15 แท่ง จากนั้นใช้ EMA แบบรวดเร็ว 2 ช่วงเวลาเพื่อสร้างตัวแกว่งที่ตอบสนองได้ในช่วง 0–100
สิ่งที่ควรมองหา
สีบอกเล่าเรื่องราว:
- เส้นสีเหลือง — ค่าพื้นฐานของ Sero (มองเห็นได้เสมอ)
- เส้นสีแดง — โมเมนตัมขาขึ้น (Sero กำลังเพิ่มขึ้น)
- เส้นสีแดงหนา — โมเมนตัมขาขึ้นที่แข็งแกร่ง (เพิ่มขึ้น + เหนือ 20 — ยืนยันการเบรกเอาท์จากภาวะขายเกิน)
- เส้นสีเขียว — โมเมนตัมขาลง (Sero กำลังลดลง)
- เส้นสีเขียวหนา — การดิ่งลงของโมเมนตัมขาลงที่รุนแรง (ลดลง + ต่ำกว่า 20 — อยู่ลึกในเขตขายเกิน)
สัญญาณสำคัญ:
- สัญญาณซื้อ — สีเปลี่ยนจากสีเขียวเป็นสีแดง โดยเฉพาะอย่างยิ่งจากต่ำกว่า 20 (การกลับตัวจากภาวะขายเกิน)
- สัญญาณขาย — สีเปลี่ยนจากสีแดงเป็นสีเขียว โดยเฉพาะอย่างยิ่งจากสูงกว่า 80 (การกลับตัวจากภาวะซื้อมากเกินไป)
- แนวโน้มที่แข็งแกร่ง — เส้นหนายืนยันความมั่นใจในโมเมนตัม
- ความเหนื่อยล้า — เส้นสีเขียวหนาต่ำกว่า 20 = ผู้ขายอาจกำลังหมดแรง ระวังการกลับตัว
แนวทางปฏิบัติที่ดีที่สุด
- ใช้งานได้บน ทุกกรอบเวลา และ ทุกเครื่องมือ
- ผสมผสานกับการเคลื่อนไหวของราคา หรือระดับแนวรับ/แนวต้านเพื่อยืนยัน
- การเปลี่ยนสีใกล้จุดสูงสุดหรือต่ำสุด (0 หรือ 100) เป็นสัญญาณที่มีความน่าจะเป็นสูงสุด
- ไม่ต้องตั้งค่า — ปรับแต่งและพร้อมใช้งานทันที
สรุป
สรุปโดย AI
Sero is a stochastic-based momentum oscillator designed to identify market momentum shifts through clear, color-coded visual signals. It calculates a smoothed stochastic value from the Typical Price [(High + Low + Close) / 3] over a 15-bar range, then applies a fast 2-period exponential moving average (EMA) to generate a responsive oscillator ranging from 0 to 100.
The indicator displays multiple colored lines to represent momentum states:
- Yellow line: base Sero value (always visible)
- Red line: bullish momentum (rising oscillator)
- Thick red line: strong bullish momentum (rising and above 20, indicating breakout from oversold)
- Green line: bearish momentum (falling oscillator)
- Thick green line: strong bearish momentum (falling and below 20, indicating deep oversold conditions)
Key signals include buy signals when the color flips from green to red, especially below 20 (oversold reversal), and sell signals when it flips from red to green, especially above 80 (overbought reversal). Thick lines confirm strong momentum trends, while thick green lines below 20 may indicate exhaustion of selling pressure and potential reversal.
Sero works on any timeframe and instrument without requiring user settings, and it is recommended to combine it with price action or support/resistance levels for confirmation. Color transitions near extremes (0 or 100) provide the highest-probability signals.
โปรไฟล์อินดิเคเตอร์
รีวิวจากลูกค้า
0.0
รีวิว: 0
รีวิวจากลูกค้า
ยังไม่มีรีวิวสำหรับผลิตภัณฑ์นี้ หากเคยลองแล้ว ขอเชิญมาเป็นคนแรกที่บอกคนอื่น!
การสนทนา
คำถามที่พบบ่อย
BTCUSD
Forex
Signal
Indices
EURUSD
Commodities
GBPUSD
NZDUSD
Crypto
Stocks
XAUUSD
NAS100
USDJPY
ผลิตภัณฑ์ที่มีให้บริการผ่าน cTrader Store รวมถึงบอทการเทรด อินดิเคเตอร์ และปลั๊กอิน มีให้บริการโดยนักพัฒนาบุคคลที่สามและมีไว้เพื่อวัตถุประสงค์ในการเข้าถึงข้อมูลและทางเทคนิคเท่านั้น cTrader Store ไม่ใช่โบรกเกอร์และไม่ได้ให้คำแนะนำการลงทุน คำแนะนำส่วนบุคคล หรือการรับประกันผลการดำเนินงานในอนาคต
เพิ่มเติมจากผู้เขียนคนนี้


ราคา
ตั้งแต่ 10/03/2026
104
ติดตั้งฟรี