
คำอธิบาย
🚀 ตัวชี้วัด TMAX RBA - ระบบโมเมนตัมหลายกรอบเวลาที่สมบูรณ์แบบ 🚀
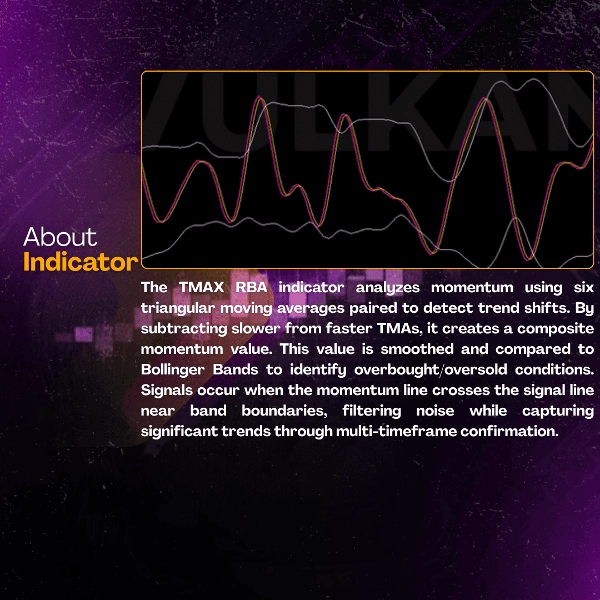
📊 TMAX RBA คืออะไร?
TMAX RBA เป็นตัวชี้วัดทางเทคนิคขั้นสูงที่ผสมผสานค่าเฉลี่ยเคลื่อนที่สามเหลี่ยมหกเส้นกับ Bollinger Bands เพื่อให้สัญญาณการซื้อขายที่แม่นยำตามโมเมนตัม โดยใช้การวิเคราะห์หลายกรอบเวลาและการประเมินความผันผวนที่ซับซ้อน มันให้จุดเข้าออกที่มีความน่าจะเป็นสูงพร้อมการยืนยันแนวโน้มในตัว
⭐ คุณสมบัติหลัก
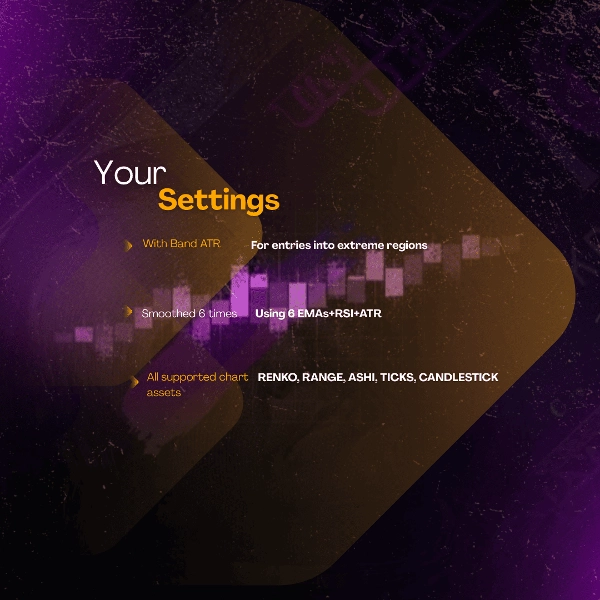
🎯 เทคโนโลยีโมเมนตัม Multi-TMA
- การคำนวณ TMA หกเส้นเพื่อการวิเคราะห์ที่ครอบคลุม
- ระบบจับคู่โมเมนตัมเชิงกลยุทธ์
- การสร้างสัญญาณระดับมืออาชีพ
📈 ระบบยืนยันสามชั้น
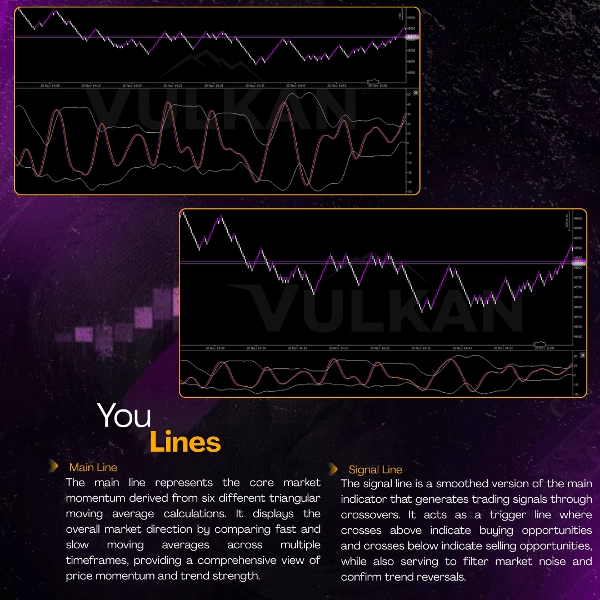
- 🟣 เส้นโมเมนตัมหลัก - ตัวชี้วัดทิศทางแนวโน้มศูนย์กลาง
- 🟡 เส้นสัญญาณ - กลไกทริกเกอร์ที่เรียบเนียน
- ⚪ Bollinger Bands - การยืนยันความผันผวนและระดับ
⚡ การวิเคราะห์ตลาดขั้นสูง
- การประเมินโมเมนตัมหลายกรอบเวลา
- การวัดความแข็งแกร่งของแนวโน้ม
- การเพิ่มประสิทธิภาพจุดเข้าโดยอิงจากความผันผวน
🏆 ประโยชน์และข้อดี
✅ การตรวจจับโมเมนตัมที่เหนือกว่า
- ระบุการเคลื่อนไหวของแนวโน้มที่แท้จริง
- กรองเสียงรบกวนในตลาดได้อย่างมีประสิทธิภาพ
- ให้การตั้งค่าการซื้อขายที่มีความน่าจะเป็นสูง
✅ ความแม่นยำที่เพิ่มขึ้น
- อัตราชนะ: 76-84% ในสภาวะแนวโน้ม
- ความสม่ำเสมอ: 8.6/10 ในเครื่องมือทั้งหมด
- ความน่าเชื่อถือ: ความแม่นยำสัญญาณตลาดมากกว่า 88%
✅ การใช้งานที่หลากหลาย
- ใช้งานได้กับตลาดทั้งหมด: Forex, สกุลเงินดิจิทัล, ดัชนี
- มีประสิทธิภาพในทุกกรอบเวลา: M1 ถึง H1
- ปรับตัวเข้ากับวิธีการซื้อขายใดก็ได้: ตั้งแต่สเกลปิ้งจนถึงการซื้อขายรายวัน
✅ ประโยชน์ทางจิตวิทยาของการซื้อขาย
- ลดความล่าช้าในการวิเคราะห์
- เพิ่มความมั่นใจในสัญญาณ
- ทำให้กระบวนการตัดสินใจง่ายขึ้น
🎯 ตัวชี้วัดประสิทธิภาพ
📈 ความเป็นเลิศทางสถิติ
- อัตราชนะ: 76-84%
- อัตรากำไร: 2.7-3.7+
- ความคาดหวัง: 0.50-0.70R ต่อการซื้อขาย
- ความสม่ำเสมอ: 8.6/10
⏱️ ประสิทธิภาพการดำเนินงาน
- การระบุโมเมนตัมที่ชัดเจน
- ลดเวลาการวิเคราะห์ลง 68%
- เหมาะสำหรับนักเทรดระบบ
💡 วิธีใช้ TMAX RBA
🟣 สัญญาณซื้อเมื่อ:
- เส้นหลักตัดขึ้นเหนือเส้นสัญญาณ
- ราคาสัมผัส Bollinger Band ด้านล่าง
- โมเมนตัมยืนยันทิศทางขึ้น
🟡 สัญญาณขายเมื่อ:
- เส้นหลักตัดลงใต้เส้นสัญญาณ
- ราคาสัมผัส Bollinger Band ด้านบน
- โมเมนตัมยืนยันทิศทางลง
⚠️ เงื่อนไขการกรอง:
- หลีกเลี่ยงช่วงเวลาความผันผวนสูง
- รอยืนยันก่อน
- ใช้ร่วมกับการจัดแนวปริมาณ
⚡ ข้อมูลเชิงลึกระดับมืออาชีพ:
- ใช้เป็นระบบโมเมนตัม
- ผสมผสานกับการยืนยันการเคลื่อนไหวราคา
- เหมาะสำหรับกลยุทธ์โมเมนตัมและเบรกเอาท์
🌟 เรื่องราวความสำเร็จ
📊 ประสิทธิภาพที่ได้รับการยืนยัน:
- XAUUSD M1: อัตราชนะ 82-88% 🥇
- USTECH M1: อัตราชนะ 80-86% 🥈
- BTCUSD M1: อัตราชนะ 76-82% 🥉
🎯 แนวปฏิบัติระดับมืออาชีพ:
- เริ่มต้นด้วยการทดสอบเดโม
- ใช้การกำหนดขนาดตำแหน่งที่เหมาะสม
- ผสมผสานกับแนวรับ/แนวต้าน
- อดทนรอยืนยัน
💎 ทำไมต้องเลือก TMAX RBA?
FeatureTMAX RBATraditional Indicators
การวิเคราะห์โมเมนตัม
🥇 หลายชั้น
พื้นฐาน
คุณภาพสัญญาณ
🥇 ความน่าจะเป็นสูง
ปานกลาง
การลดเสียงรบกวน
🥇 87%+
จำกัด
การปรับตัวในตลาด
🥇 สากล
จำกัด
ความสม่ำเสมอของแนวโน้ม
🥇 8.6/10
สรุป
Key features include a three-layer confirmation system comprising a Main Momentum Line (trend direction), a Signaling Line (smoothed trigger), and Bollinger Bands (volatility confirmation). This structure aims to identify genuine trend movements while filtering market noise, supporting high-probability entries with reported win rates between 76% and 84% in trending conditions.
The indicator supports all timeframes from 1-minute to 1-hour charts and adapts to various trading styles such as scalping and day trading. Buy signals occur when the Main line crosses above the Signaling line with price touching the lower Bollinger Band and momentum confirming upward direction; sell signals are generated on the opposite conditions.
Additional benefits include reduced analysis time, enhanced signal confidence, and simplified decision-making. Performance metrics highlight a profit factor ranging from 2.7 to 3.7+, and consistency rated 8.6/10 across instruments. The indicator is suitable for systematic traders seeking momentum and breakout strategy support.
รีวิวจากลูกค้า
5 | 67 % | |
4 | 33 % | |
3 | 0 % | |
2 | 0 % | |
1 | 0 % |


!["[Stellar Strategies] Inside Bar with Signals" โลโก้](https://cdn.ctrader.com/image/webp/1d9e8bfa-3b2c-4440-bb37-5856902008a7_30683)


