
Higher TimeFrame Candle Tracker
Wskaźnik
1 zakupy
Wersja 1.0, Oct 2025
Windows, Mac
Opis
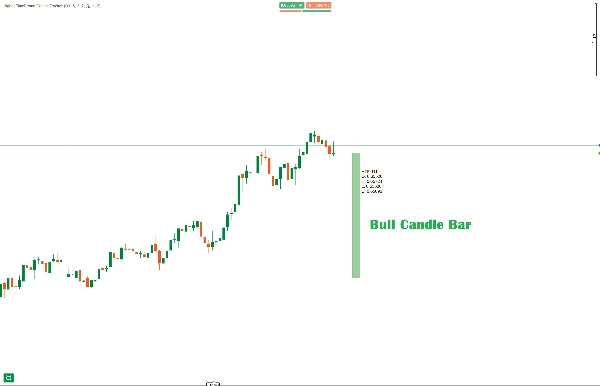
Śledzenie świec na wyższym interwale czasowym służy do uzyskania wglądu, jak wygląda wybrana świeca z wyższego interwału czasowego.
Kluczowe cechy:
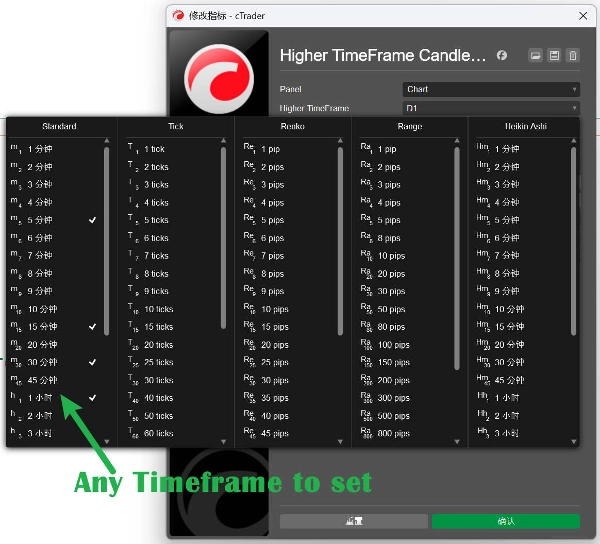
- Dostosowywany wybór interwału czasowego - Wybierz dowolny wyższy interwał czasowy (Dzienny, Tygodniowy, Miesięczny itp.)
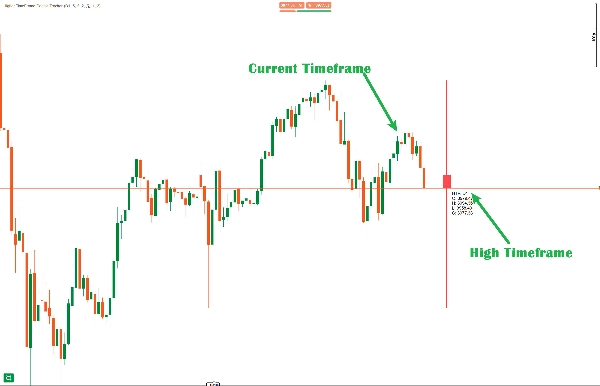
- Wizualny wyświetlacz świecy - Aktualna świeca HTF jest rysowana z odpowiednimi knotami i korpusem, odsunięta od bieżącej akcji cenowej
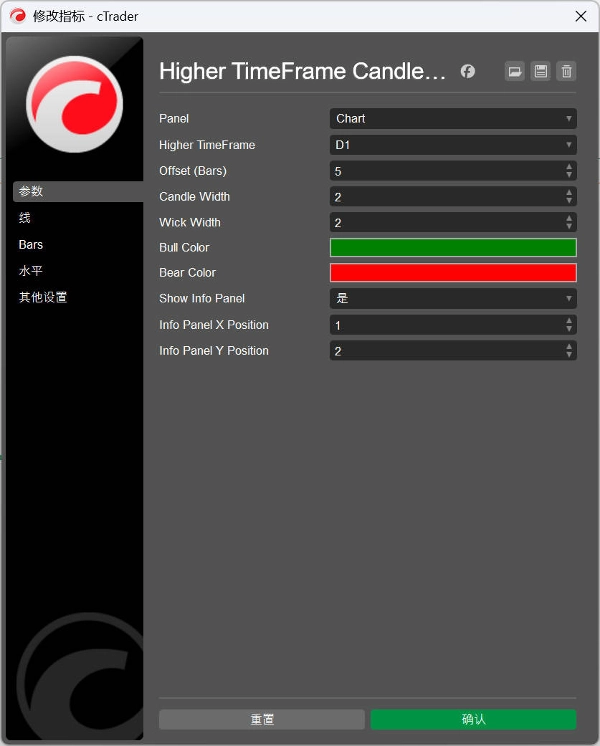
Regulowane ustawienia:
- Offset: Odległość w słupkach od bieżącej ceny (domyślnie: 5)
- Szerokość świecy: Grubość korpusu świecy (1-10, domyślnie: 3)
- Szerokość knota: Grubość linii knota (1-5, domyślnie: 1)
- Kolory: Dostosowywane kolory byków (zielony) i niedźwiedzi (czerwony)
Obsługiwane interwały czasowe:
- Minute, Minute2, Minute3, Minute4, Minute5
- Minute10, Minute15, Minute30, Minute45
- Hour, Hour4, Hour12
- Daily, Day2, Day3
- Weekly, Monthly
Tabela informacji - Wyświetla dane świecy HTF w czasie rzeczywistym: wartości Otwarcia, Maksimum, Minimum, Zamknięcia.
中文说明:
可自定义参数:
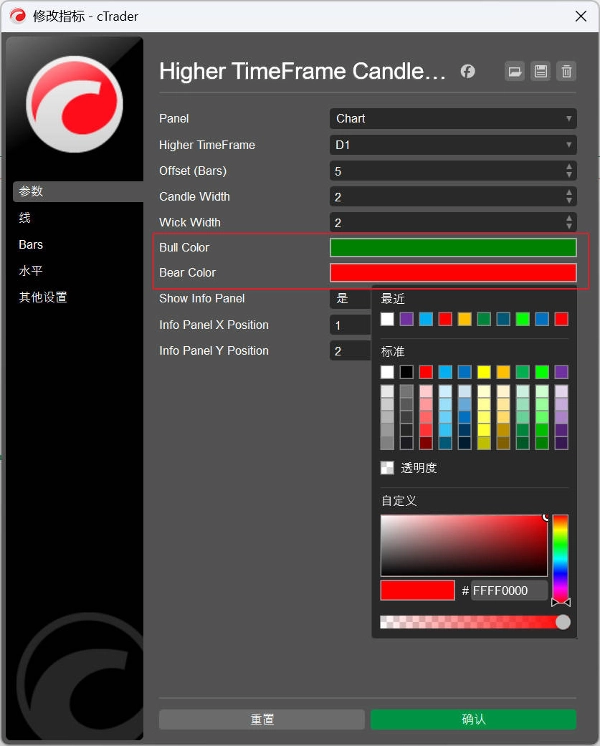
- Higher TimeFrame(高时间框架) - 选择要跟踪的时间框架(默认:Daily)
- Offset(偏移量) - K线距离当前价格的位置(默认:5根K线)
- Candle Width(K线宽度) - K线实体的宽度(1-10,默认:3)
- Wick Width(影线宽度) - 影线的宽度(1-5,默认:2)
- Bull Color(看涨颜色) - 看涨K线颜色(默认:Green)
- Bear Color(看跌颜色) - 看跌K线颜色(默认:Red)
- Show Info Panel(显示信息面板) - 是否显示HTF数据面板(默认:true)
核心特性:
- 实时HTF K线显示 - 在图表上绘制当前高时间框架K线
- 完整的K线结构 - 包含实体、上影线和下影线
- 颜色区分 - 自动根据涨跌使用不同颜色
- 信息面板 - 显示Open、High、Low、Close和方向指示
- 自适应填充 - 看涨K线半透明,看跌K线较深
支持的时间框架:
- Minute, Minute2, Minute3, Minute4, Minute5
- Minute10, Minute15, Minute30, Minute45
- Hour, Hour4, Hour12
- Daily, Day2, Day3
- Weekly, Monthly
Podsumowanie
Profil wskaźnika
Opinie klientów
0.0
Opinie: 0
Opinie klientów
Ten produkt nie ma jeszcze opinii. Wypróbowałeś(-aś) go już? Bądź pierwszy(-a) i powiedz o tym innym!
Dyskusja
Częste pytania
Prop
Forex
Breakout
Indices
Commodities
Crypto
Stocks
Produkty dostępne za pośrednictwem cTrader Store, w tym boty handlowe, wskaźniki i wtyczki, dostarczane są przez deweloperów zewnętrznych i udostępniane wyłącznie w celach informacyjnych oraz w celu zapewnienia dostępu technicznego. cTrader Store nie jest brokerem i nie zapewnia doradztwa inwestycyjnego, nie udziela spersonalizowanych rekomendacji ani nie gwarantuje przyszłych wyników.


![Logo „[Stellar Strategies] MARSI Signal Plotter”](https://cdn.ctrader.com/image/webp/7b2b8da6-8f8e-4646-8d4a-4710c516c01e_25567)


Cena
Od 30/09/2024
44
Sprzedaż