
Parabolic RSI Alert V1
อินดิเคเตอร์
3 การซื้อ
เวอร์ชัน 1.0, Aug 2025
Windows, Mac
4.5
รีวิว: 2
คำอธิบาย
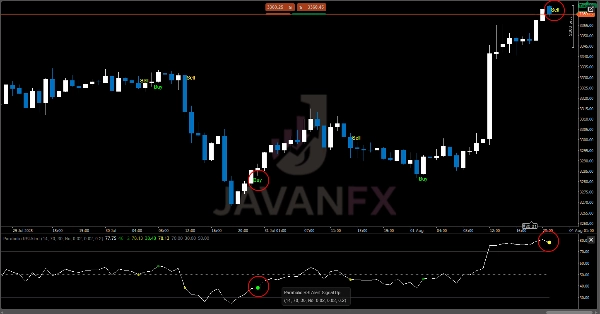
Parabolic RSI Alert เป็นตัวบ่งชี้ที่ทรงพลังซึ่งผสานความแม่นยำของ Relative Strength Index (RSI) กับความสามารถในการติดตามแนวโน้มแบบไดนามิกของ custom Parabolic SAR การผสมผสานที่เป็นเอกลักษณ์นี้ช่วยให้นักเทรดสามารถระบุ จุดกลับตัวที่มีความน่าจะเป็นสูง ด้วยสัญญาณภาพที่ชัดเจนและการแจ้งเตือนแบบเรียลไทม์
หมายเหตุการใช้งาน:
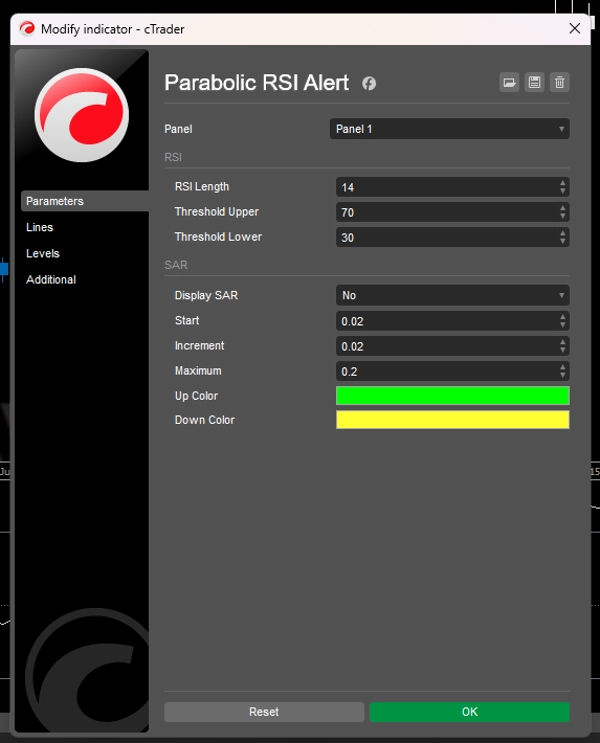
- ตัวบ่งชี้ทำงานได้ดีที่สุดในกรอบเวลาตั้งแต่ 1 ชั่วโมงขึ้นไป
- สัญญาณที่แข็งแกร่งเกิดขึ้นเมื่อมีการกลับตัวในโซนที่ซื้อมากเกินไป/ขายมากเกินไป
- สัญญาณปกติจะปรากฏเมื่อมีการกลับตัวนอกโซนสุดขีด
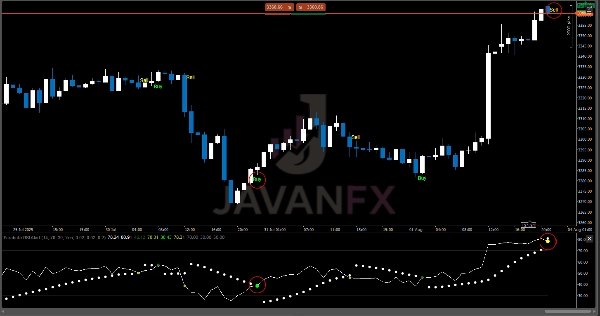
- จุด SAR จะถูกวางเฉพาะเมื่อ
Display SARเปิดใช้งาน - ผสมผสานกับการเคลื่อนไหวของราคาและตัวบ่งชี้อื่นๆ เพื่อยืนยันจุดเข้าและออก (ไม่บังคับ)
เหมาะสำหรับนักเทรดที่:
- ต้องการ ลดความล่าช้า ในการวิเคราะห์ RSI แบบดั้งเดิม
- ต้องการ สัญญาณภาพและเสียงที่ชัดเจน สำหรับการเข้าทำรายการที่ทันเวลา
- ชอบ สัญญาณเชิงกลไก มากกว่าการอ่านกราฟแบบอัตนัย
สรุป
สรุปโดย AI
The Parabolic RSI Alert indicator integrates the Relative Strength Index (RSI) with a custom Parabolic SAR to identify high-probability trend reversal points. It provides clear visual signals and real-time alerts to assist traders in timely decision-making. Designed for use on 1-hour and higher timeframes, the indicator highlights strong reversal signals particularly when they occur in overbought or oversold zones, while also signaling less extreme reversals. Parabolic SAR points are displayed when the corresponding option is enabled. This tool aims to reduce lag commonly associated with traditional RSI analysis and offers mechanical, objective signals supported by both visual and audible alerts. It is suitable for traders who prefer systematic entry and exit cues and can be combined with price action or other indicators for confirmation.
โปรไฟล์อินดิเคเตอร์
รีวิวจากลูกค้า
4.5
รีวิว: 2
5 | 50 % | |
4 | 50 % | |
3 | 0 % | |
2 | 0 % | |
1 | 0 % |
รีวิวจากลูกค้า
October 10, 2025
Smooth combo! 🎯 Parabolic RSI Alert mixes momentum & trend perfectly — clean entries, fewer fakeouts. Great hybrid for swing or intraday setups.
August 18, 2025
การสนทนา
คำถามที่พบบ่อย
ผลิตภัณฑ์ที่มีให้บริการผ่าน cTrader Store รวมถึงบอทการเทรด อินดิเคเตอร์ และปลั๊กอิน มีให้บริการโดยนักพัฒนาบุคคลที่สามและมีไว้เพื่อวัตถุประสงค์ในการเข้าถึงข้อมูลและทางเทคนิคเท่านั้น cTrader Store ไม่ใช่โบรกเกอร์และไม่ได้ให้คำแนะนำการลงทุน คำแนะนำส่วนบุคคล หรือการรับประกันผลการดำเนินงานในอนาคต


!["[Hamster-Coder] Pivot Points MTF" โลโก้](https://cdn.ctrader.com/image/webp/4c143e5a-309c-40e3-a578-f04d1e133ffa_31159)


!["[Stellar Strategies] Inside Bar with Signals" โลโก้](https://cdn.ctrader.com/image/webp/1d9e8bfa-3b2c-4440-bb37-5856902008a7_30683)


ราคา
ตั้งแต่ 14/07/2025
60
การขาย