
MA Sabres
อินดิเคเตอร์
2 การซื้อ
เวอร์ชัน 1.0, Aug 2025
Windows, Mac
4.5
รีวิว: 2
คำอธิบาย
ครองตลาดด้วยตัวบ่งชี้ที่น่าตื่นเต้นนี้ซึ่งระบุการกลับตัวของแนวโน้มโดยใช้ค่าเฉลี่ยเคลื่อนที่แบบไดนามิก ปลดปล่อยรูปแบบ 'Sabre' ที่กล้าหาญในฐานะโซนสนับสนุน ต้านทาน หรือเบรกเอาต์ ด้วยการตั้งค่าที่ปรับแต่งได้และการแจ้งเตือนที่แม่นยำ มันคืออาวุธลับของคุณสำหรับความสำเร็จในการเทรด!
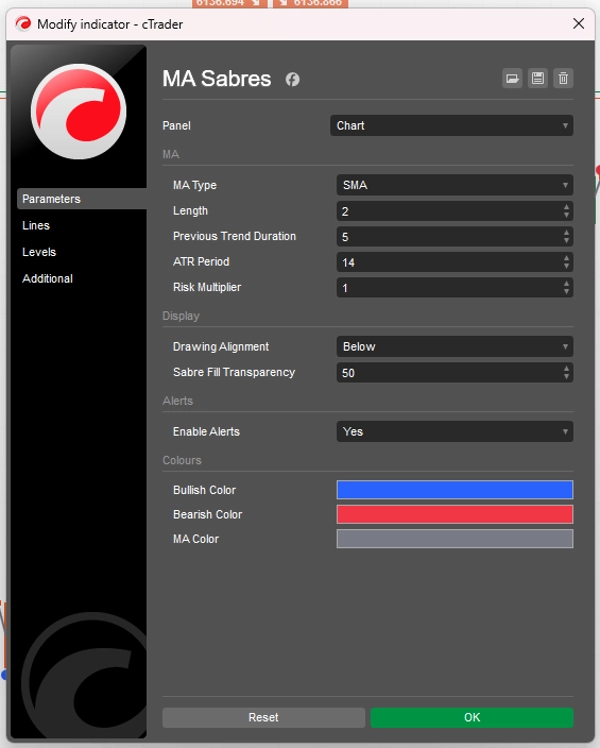
การตั้งค่า
- ประเภท MA: เลือกค่าเฉลี่ยเคลื่อนที่ของคุณจากเมนูแบบเลื่อนลง (SMA, EMA, SMMA_RMA, HullMA, WMA, VWMA, DEMA, TEMA, NONE เพื่อปิดใช้งาน) ค่าเริ่มต้นคือ TEMA สำหรับสัญญาณที่รวดเร็ว
-
- ความยาว: ตั้งค่าความยาวของ MA และ Sabre (ค่าเริ่มต้น: 50, ขั้นต่ำ: 1) เพื่อควบคุมขอบเขต
- ระยะเวลาของแนวโน้มก่อนหน้า: กำหนดจำนวนแท่งเทียน (ค่าเริ่มต้น: 20, ขั้นต่ำ: 1) ที่ MA ต้องมีแนวโน้มก่อนที่จะเกิดการกลับตัวและกระตุ้น Sabre
- ช่วงเวลา ATR: ปรับช่วงเวลา Average True Range (ค่าเริ่มต้น: 14, ขั้นต่ำ: 1) เพื่อกำหนดตำแหน่ง Sabre ตามความผันผวนของตลาด
- ตัวคูณความเสี่ยง: ขยายหรือย่อระยะห่างของ Sabre จากราคา (ค่าเริ่มต้น: 1.0, ช่วง: 0.1–5.0) เพื่อสัญญาณที่กล้าหรือเข้มงวดขึ้น
- การจัดตำแหน่งการวาด: วาง Sabres และวงกลมไว้ด้านบน ด้านล่าง หรือกึ่งกลาง (ค่าเริ่มต้น: กึ่งกลาง) เพื่อหลีกเลี่ยงความรกบนกราฟ
- ความโปร่งใสของการเติม Sabre: ปรับความทึบของการเติม (ค่าเริ่มต้น: 50, ช่วง: 0–100) เพื่อมองเห็นได้ชัดเจน
- เปิดใช้งานการแจ้งเตือน: สลับสวิตช์ (ค่าเริ่มต้น: ปิด) เพื่อรับการแจ้งเตือนเสียง
วิธีใช้
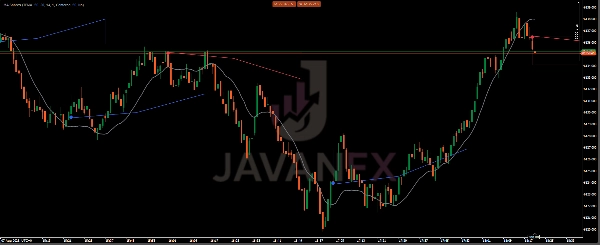
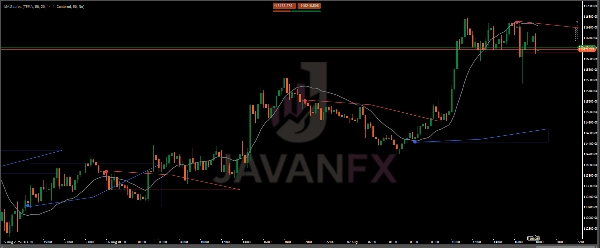
- ระบุการกลับตัว:
-
- มองหา Sabres (เส้นแนวโน้มสี่เส้นที่มีฐานเติมสี) และวงกลม (ไอคอนสามชั้น) เมื่อ MA เปลี่ยนหลังจากแนวโน้มที่มั่นคง
- Sabres ขาขึ้นพร้อมวงกลมสีน้ำเงินบ่งชี้การเพิ่มขึ้นของตลาดขาขึ้น; Sabres ขาลงพร้อมวงกลมสีแดงเตือนการลดลงของตลาดขาลง
- ปรับแต่งการตั้งค่าของคุณ:
-
- ลดความยาว (เช่น 20) และระยะเวลาของแนวโน้มก่อนหน้า (เช่น 10) สำหรับการเคลื่อนไหวที่รวดเร็วในตลาดที่ผันผวน
- เพิ่มตัวคูณความเสี่ยง (เช่น 2.0) เพื่อขยาย Sabres ในแนวโน้มหรือปรับลด (เช่น 0.5) เพื่อความแม่นยำในช่วงขอบเขต
- เปลี่ยนการจัดตำแหน่งเป็นด้านบนหรือล่างหากแท่งเทียนบดบังการมองเห็น
- ใช้ประโยชน์จากการแจ้งเตือน:
-
- เปิดใช้งาน EnableAlerts เพื่อรับการแจ้งเตือนแบบเรียลไทม์บนกราฟ
- กลยุทธ์การเทรด:
-
- เข้าเทรด: เข้าทำการซื้อเมื่อพบ Sabre/วงกลมขาขึ้น หรือขายเมื่อพบ Sabre/วงกลมขาลง
- ออกเทรด: ติดตามแนวโน้มเส้น MA เป็นจุดหยุดขาดทุน หรือออกเมื่อได้รับสัญญาณ Sabre ฝั่งตรงข้าม
- การตรวจสอบความถูกต้อง: รวมกับเครื่องมือเช่น UT Bot Alert, RSI หรือ Bollinger Bands เพื่อการตั้งค่าที่มั่นคง
สรุป
โปรไฟล์อินดิเคเตอร์
รีวิวจากลูกค้า
4.5
รีวิว: 2
5 | 50 % | |
4 | 50 % | |
3 | 0 % | |
2 | 0 % | |
1 | 0 % |
รีวิวจากลูกค้า
October 10, 2025
Smooth and clean ⚡ MA Sabres cuts through noise like blades — great trend clarity, fast updates, and zero lag. Perfect base for MA-based systems!
August 14, 2025
Demo first, then maybe small size if the notes look sane. Account protection still comes first.
การสนทนา
คำถามที่พบบ่อย
ผลิตภัณฑ์ที่มีให้บริการผ่าน cTrader Store รวมถึงบอทการเทรด อินดิเคเตอร์ และปลั๊กอิน มีให้บริการโดยนักพัฒนาบุคคลที่สามและมีไว้เพื่อวัตถุประสงค์ในการเข้าถึงข้อมูลและทางเทคนิคเท่านั้น cTrader Store ไม่ใช่โบรกเกอร์และไม่ได้ให้คำแนะนำการลงทุน คำแนะนำส่วนบุคคล หรือการรับประกันผลการดำเนินงานในอนาคต


ราคา
ตั้งแต่ 14/07/2025
60
การขาย