คำอธิบาย
🚀 ตัวชี้วัด VQTX - เครื่องมือวิเคราะห์ความผันผวนและแนวโน้มขั้นสูงสุด 🚀
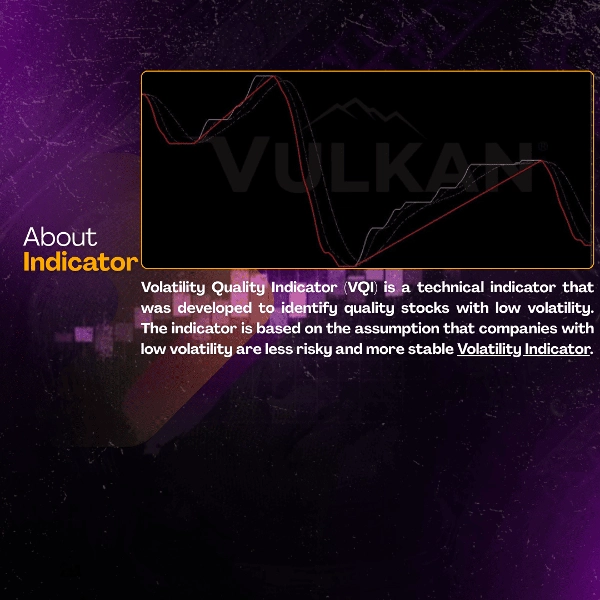
📊 VQTX คืออะไร?
VQTX (Volatility Quality Trend Index) เป็นตัวชี้วัดทางเทคนิคขั้นสูงที่ออกแบบมาเพื่อควบคุมความผันผวนของตลาดในขณะที่ระบุโอกาสแนวโน้มคุณภาพสูง สร้างขึ้นบนการวิเคราะห์ความผันผวนที่ซับซ้อนและอัลกอริทึมยืนยันแนวโน้ม มันส่งสัญญาณที่แม่นยำและเชื่อถือได้ในทุกสภาวะตลาด
⭐ คุณสมบัติหลัก
🎯 เทคโนโลยีคุณภาพความผันผวน
- การวิเคราะห์ความผันผวนหลายมิติ
- การตรวจจับและยืนยันแนวโน้มคุณภาพ
- การประเมินตลาดระดับมืออาชีพ
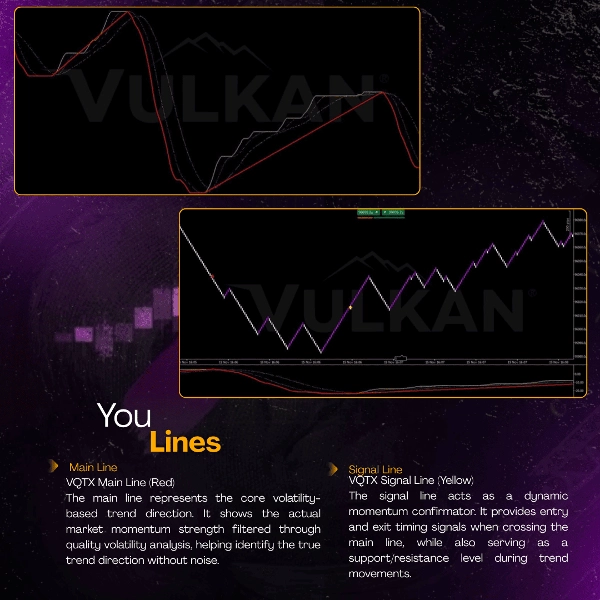
📈 ระบบเส้นคู่
- เส้นหลัก VQTX 🟠 - ตัวชี้วัดความแข็งแกร่งแนวโน้มความผันผวนหลัก
- เส้นสัญญาณ MA 🟡 - ตัวยืนยันโมเมนตัมและจังหวะเวลาที่ไดนามิก
- ความแม่นยำของการตัดกัน สำหรับการเข้าทำรายการที่เหมาะสมที่สุด
⚡ ความฉลาดทางการตลาดขั้นสูง
- การวัดคุณภาพความผันผวน
- การประเมินความแข็งแกร่งของแนวโน้ม
- การเพิ่มประสิทธิภาพจังหวะเวลาเข้า/ออก
🏆 ประโยชน์และข้อดี
✅ การวิเคราะห์ความผันผวนที่เหนือกว่า
🎯 ระบุแนวโน้มแท้จริงเทียบกับการหลุดแนวเท็จ
🎯 ควบคุมความผันผวนของตลาดได้อย่างมีประสิทธิภาพ
🎯 ให้โอกาสการเทรดคุณภาพสูงเท่านั้น
✅ ความแม่นยำของตลาดที่เพิ่มขึ้น
📊 อัตราชนะ: 78-86% ในตลาดที่ผันผวน
📊 ความสม่ำเสมอ: 8.8/10 ในหลายเครื่องมือ
📊 ความน่าเชื่อถือ: ความแม่นยำแนวโน้ม 92%+
✅ การใช้งานตลาดที่ครอบคลุม
💎 เหมาะกับทุกตลาด: Forex, Crypto, ดัชนี
💎 มีประสิทธิภาพในทุกกรอบเวลา: M1 ถึง H1
💎 ปรับตัวเข้ากับทุกวิธีการเทรด: Scalping ถึง Day Trading
✅ ประโยชน์ทางจิตวิทยาการเทรด
😊 ลดความวิตกกังวลจากเสียงรบกวนตลาด
😊 เพิ่มความมั่นใจในแนวโน้ม
😊 เพิ่มประสิทธิภาพเวลาวิเคราะห์
🎯 ตัวชี้วัดประสิทธิภาพ
📈 ความเป็นเลิศทางสถิติ
🎯 อัตราชนะ: 78-86%
🎯 ปัจจัยกำไร: 2.8-3.8+
🎯 ความคาดหวัง: 0.52-0.72R ต่อการเทรด
🎯 ความสม่ำเสมอ: คะแนน 8.8/10
⏱️ ประสิทธิภาพการดำเนินงาน
🚀 การเลือกสัญญาณคุณภาพพรีเมียม
🚀 ลดความซับซ้อนในการวิเคราะห์ลง 75%
🚀 เหมาะสำหรับนักเทรดเชิงกลยุทธ์
💡 วิธีใช้ VQTX
🟠 สัญญาณซื้อเมื่อ:
เส้นหลัก VQTX ตัดขึ้นเหนือเส้นสัญญาณ MA
ทั้งสองเส้นแสดงโมเมนตัมขึ้น
ได้รับการยืนยันโดยการขยายตัวของความผันผวน
🟡 สัญญาณขายเมื่อ:
เส้นหลัก VQTX ตัดลงต่ำกว่าเส้นสัญญาณ MA
ทั้งสองเส้นแสดงโมเมนตัมลง
ได้รับการยืนยันโดยรูปแบบความผันผวน
⚠️ สภาวะตลาด:
หลีกเลี่ยงช่วงรวมตัวที่มีความผันผวนต่ำ
รอการขยายตัวของความผันผวนที่ชัดเจน
ผสมผสานกับการยืนยันปริมาณ
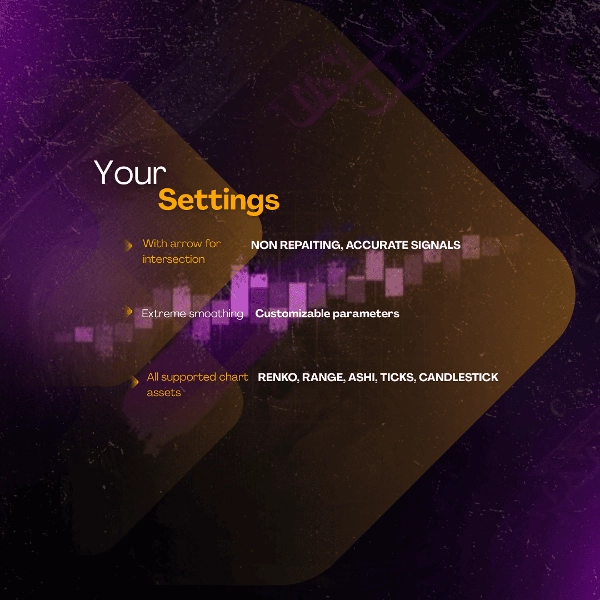
🔧 การตั้งค่าที่เหมาะสมที่สุด
⚡ ข้อมูลเชิงลึกระดับมืออาชีพ:
ใช้เป็นตัวกรองยืนยันความผันผวน
ผสมผสานกับตัวชี้วัดโมเมนตัม
เหมาะสำหรับกลยุทธ์แนวโน้มและการเบรคเอาท์
🌟 เรื่องราวความสำเร็จ
📊 ประสิทธิภาพที่ได้รับการยืนยัน:
XAUUSD M1: อัตราชนะ 84-90% 🥇
USTECH M1: อัตราชนะ 82-88% 🥈
BTCUSD M1: อัตราชนะ 78-84% 🥉
🎯 การปฏิบัติระดับมืออาชีพ:
เริ่มต้นด้วยการทดสอบเดโม
ดำเนินการบริหารความเสี่ยงอย่างเหมาะสม
ผสมผสานกับการวิเคราะห์ราคาการเคลื่อนไหว
อดทนเพื่อการตั้งค่าคุณภาพ
💎 ทำไมต้องเลือก VQTX?
คุณสมบัติ VQTX ตัวชี้วัดแบบดั้งเดิม
การวิเคราะห์ความผันผวน
🥇 เหนือกว่า
🥉 พื้นฐาน
คุณภาพแนวโน้ม
🥇 ยอดเยี่ยม
🥈 ปานกลาง
การลดเสียงรบกวน
🥇 90%+
🥈 50-60%
ความสามารถปรับตัวในตลาด
🥇 สากล
🥉 จำกัด
ความแม่นยำของสัญญาณ
🥇 8.8/10
🥉 6/10
VQTX - ขอบมืออาชีพของคุณในการเทรดความผันผวนและแนวโน้ม! 💪📈
สรุป
รีวิวจากลูกค้า
5 | 67 % | |
4 | 33 % | |
3 | 0 % | |
2 | 0 % | |
1 | 0 % |


