
Institutional Flow Radar
Indikator
3 käufe
Version 1.0, Nov 2025
Windows, Mac
4.3
Bewertungen: 3
Beschreibung
Institutioneller Flow Radar – Beschreibung
Konzept:
Der Institutional Flow Radar durchsucht das Chart nach abnormen Volumenereignissen und klassifiziert diese in zwei Gruppen:
- Kapital → Aktivität, die stärkeren / besser informierten Teilnehmern zugeschrieben wird
- Öffentlichkeit → Aktivität, die der breiten Masse zugeschrieben wird
Anschließend:
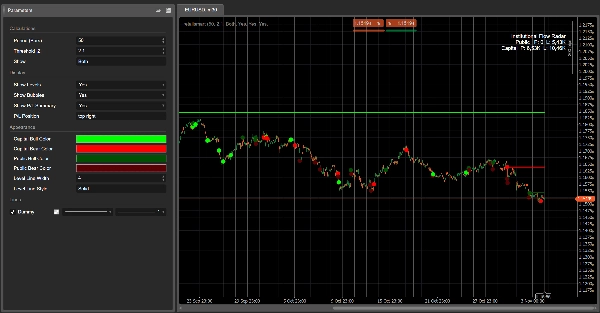
- zeichnet horizontale Niveaus bei diesen Ereignissen,
- markiert die relevantesten Ereignisse mit farbigen Blasen,
- und zeigt eine Gewinn-/Verlust-Zusammenfassung, die vergleicht, wie viel Volumen von Kapital vs Öffentlichkeit derzeit Gewinn oder Verlust macht.
Auf einen Blick sehen Sie wo großes Volumen auf das Tape traf, wer gewinnt, und welche Preise noch halten.
Wie es funktioniert (kurze Version)
- Für jede Kerze berechnet der Algorithmus einen Z-Score des Volumens über die letzten N Kerzen (Periode).
- Wenn der absolute Z-Score über Ihrem Schwellenwert |Z| liegt, wird diese Kerze als Volumenereignis markiert.
- Die Kerzenstruktur (Körper vs Gesamtrange) wird zur Klassifizierung des Ereignisses verwendet:
-
- kleinerer Körper, lange Dochte → Kapital (Absorption / komplexeres Verhalten)
- größerer Körper, richtungsweisende Bewegung → Öffentlichkeit (Massen-Ausbruch / Verfolgung)
- Ein horizontales Niveau wird auf dem Ereignispreis gezeichnet und bleibt bestehen, bis der Preis dieses Niveau sauber durchbricht (Abmilderung).
- Für jedes aktive Niveau prüft der Radar, ob der aktuelle Preis:
-
- im Gewinn für diese Seite ist (Preis hat sich in Richtung des Ereignisses bewegt), oder
- im Verlust (Preis hat sich dagegen bewegt).
- Die Gewinn-/Verlust-Zusammenfassungsbox fasst die Volumina aller aktiven Niveaus zusammen:
-
- Kapital Gewinn vs Kapital Verlust
- Öffentlichkeit Gewinn vs Öffentlichkeit Verlust
Visuelle Elemente
- Kapitalniveaus:
-
- Aufwärtsereignisse → bullisches Kapitalniveau (z.B. hellgrün / aqua)
- Abwärtsereignisse → bärisches Kapitalniveau (z.B. hellrot)
- Öffentlichkeitsniveaus:
-
- Aufwärtsereignisse → bullisches Öffentlichkeitsniveau (grauer Ton)
- Abwärtsereignisse → bärisches Öffentlichkeitsniveau (dunkleres Grau / Anthrazit)
- Blasen:
-
- Kreise bei den bedeutendsten Ereignissen, gefärbt nach:
-
- Richtung (bullisch/bärisch)
- Klasse (Kapital / Öffentlichkeit)
- Gewinn-/Verlust-Zusammenfassungsbox:
-
- Zeilen: Öffentlichkeit, Kapital
- Spalten: Gewinn, Verlust
- Die Hintergrundintensität der Zellen steigt mit dem entsprechenden Volumen.
Vorgeschlagene Parameterbezeichnungen (Englisch)
- Periode (Kerzen): Anzahl der Kerzen, die zur Berechnung des Volumen-Z-Scores verwendet werden.
- Schwellenwert |Z|: minimaler absoluter Z-Score, um ein Ereignis zu markieren.
- Anzeigen:
Kapital,ÖffentlichkeitoderBeide– welche Klasse angezeigt werden soll. - Niveaus anzeigen / Blasen anzeigen / Gewinn-/Verlust-Zusammenfassung anzeigen
- Kapital Bull Farbe / Kapital Bear Farbe
- Öffentlichkeit Bull Farbe / Öffentlichkeit Bear Farbe
- Durchschnittliche Linienbreite / Durchschnittlicher Linienstil
Zusammenfassung
KI-Zusammenfassung
Institutional Flow Radar is a trading indicator that identifies and classifies abnormal volume events on price charts into two categories: Capital (activity from stronger or more informed participants) and Public (activity from the broader crowd). It calculates a volume Z-score for each bar over a specified period and flags bars exceeding a set threshold as volume events. These events are further classified based on candle structure—smaller bodies with long wicks indicate Capital activity, while larger bodies with directional moves indicate Public activity.
The indicator visually marks these events by drawing horizontal levels at event prices, which remain until price moves decisively through them. Significant events are highlighted with colored bubbles indicating direction (bullish or bearish) and classification (Capital or Public). A P/L summary box aggregates volume at active levels, showing Capital and Public volumes currently in profit or loss.
Users can customize parameters such as the period for Z-score calculation, threshold for event detection, and visual settings including colors for bullish and bearish levels for both Capital and Public groups. This tool provides a consolidated view of where large volume occurred, which participant group is prevailing, and which price levels are holding, aiding in volume-based breakout analysis.
Indikatorprofil
Kundenbewertungen
4.3
Bewertungen: 3
5 | 33 % | |
4 | 67 % | |
3 | 0 % | |
2 | 0 % | |
1 | 0 % |
Kundenbewertungen
November 18, 2025
The only reason it stays interesting is the trading notes stop feeling so random, and two sessions say more than one clean chart.
November 9, 2025
Diskussion
Häufig gestellte Fragen (FAQ)
Breakout
Über den cTrader Store verfügbare Produkte, einschließlich Handelsbots, Indikatoren und Plugins, werden von externen Entwicklern bereitgestellt und nur zu Informations- und technischen Zugriffszwecken verfügbar gemacht. cTrader Store ist kein Broker und erbringt keine Anlageberatung, persönlichen Empfehlungen oder eine Garantie für zukünftige Performance.


Preis
42.11M
Gehandeltes Volumen
6.13M
Pip-Gewinn
222
Verkäufe
8.39K
Kostenlose Installationen