
คำอธิบาย
ควบคุมการเทรด CCI ของคุณ!
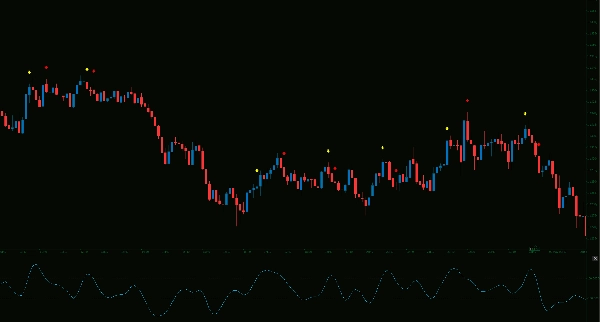
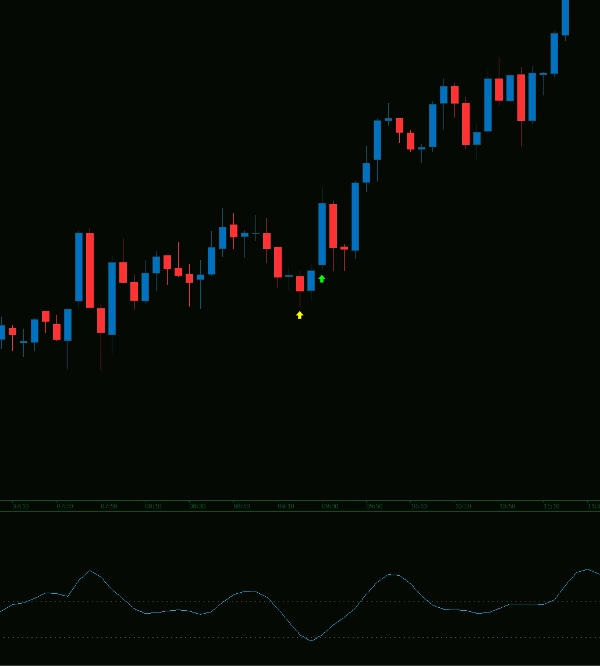
ตัวบ่งชี้ Smoothed CCI ขั้นสูงนี้มีการแจ้งเตือนและสัญญาณภาพที่ปรับแต่งได้อย่างเต็มที่ ชี้จุดการเบรคเอาท์ของ CCI ด้วยลูกศรขึ้น/ลงที่ชัดเจน (กระทิง/หมี, เข้า/ออก) และเลือกเสียงแจ้งเตือนที่คุณชื่นชอบจากรายการในตัว กรองสัญญาณเพื่อโฟกัสเฉพาะการตั้งค่ากระทิงหรือหมีเท่านั้น CCI ของคุณ กฎของคุณ!
หมายเหตุสำคัญเพื่อเพิ่มโอกาสความสำเร็จสูงสุด:
แม้ว่าจะทรงพลัง แต่สิ่งสำคัญคือต้องใช้ตัวบ่งชี้นี้เป็นเครื่องมือสำหรับ การรวมกันของปัจจัย ไม่ใช่เป็นตัวตัดสินใจเข้าเทรดเพียงอย่างเดียว ปรับปรุงความแม่นยำและความสำเร็จในการเทรดของคุณอย่างมากโดยการผสมผสาน การวิเคราะห์หลายกรอบเวลา (MTFA) เพื่อกำหนดแนวโน้มทิศทางที่ชัดเจรก่อนดำเนินการตามสัญญาณ
ปลดล็อกศักยภาพที่แท้จริง:
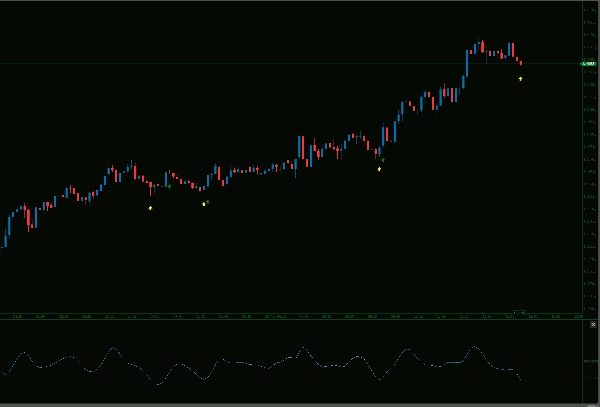
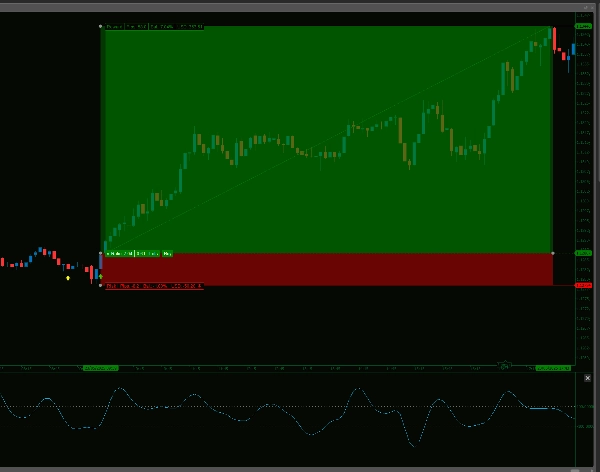
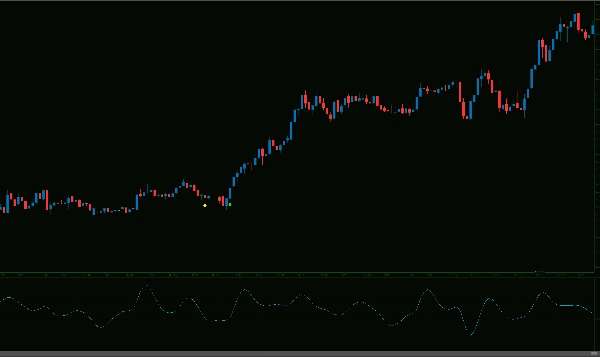
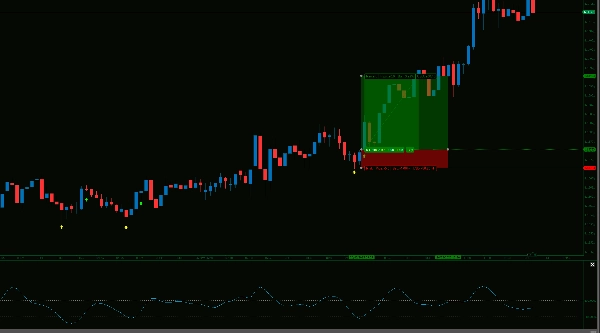
จุดแข็งหลักของ Hull Smoothed CCI อยู่ที่ความสามารถในการระบุพื้นที่ที่ตลาดได้ขยายตัวเกินไปหรือแก้ไขมากเกินไปและพร้อมที่จะ กลับมาเดินตามแนวโน้มเดิม มันช่วยให้คุณเห็นช่วงเวลาที่เส้นยางยืดพร้อมจะดีดกลับ!
ตัวอย่างเช่น กลยุทธ์ที่มีประสิทธิภาพสูงคือการรอให้ CCI 5 นาทีลดลงต่ำกว่า -100 ซึ่งตรงตามเกณฑ์แจ้งเตือนกระทิงของคุณ จากนั้นมองหา โอกาสซื้อในกราฟ 1 นาทีเมื่อเกิดการเบรคโครงสร้าง ในทิศทางของแนวโน้มกรอบเวลาที่สูงกว่าที่คุณกำหนด วิธีการนี้เป็นขั้นตอนที่เป็นระบบและสามารถให้จุดเข้าเทรดที่ยอดเยี่ยม
เชี่ยวชาญการรวมกันเหล่านี้ และ Hull Smoothed CCI จะกลายเป็นทรัพย์สินที่มีค่าสำหรับชุดเครื่องมือเทรดของคุณ!
โปรดทราบว่าแจ้งเตือนรองรับเฉพาะบนอุปกรณ์วินโดวส์เท่านั้น
--------------------------
โปรดตรวจสอบตัวบ่งชี้อื่นๆ ของฉันได้เลย!
https://ctrader.com/products/1181
https://ctrader.com/products/1182
https://ctrader.com/products/1180
https://ctrader.com/products/1015
https://ctrader.com/products/555
https://ctrader.com/products/553
https://ctrader.com/products/554
https://ctrader.com/products/552
https://ctrader.com/products/557
https://ctrader.com/products/845
https://ctrader.com/products/848
https://ctrader.com/products/847
https://ctrader.com/products/846
https://ctrader.com/products/551
https://ctrader.com/products/574
https://ctrader.com/products/573
https://ctrader.com/products/556
https://ctrader.com/products/558
https://ctrader.com/products/559
https://ctrader.com/products/560
สรุป
รีวิวจากลูกค้า
5 | 100 % | |
4 | 0 % | |
3 | 0 % | |
2 | 0 % | |
1 | 0 % |


