
คำอธิบาย
Candles Volume Delta เป็นตัวบ่งชี้ที่ทรงพลังและเข้าใจง่ายทางสายตา ซึ่งเปลี่ยนปริมาณทิกดิบให้กลายเป็นข้อมูลเชิงลึกสำหรับการเทรดที่นำไปใช้ได้จริง โดยการระบายสีแท่งราคาโดยอิงจากแรงกดดันของปริมาณซื้อ/ขาย มันให้สัญญาณทางสายตาทันทีเกี่ยวกับความรู้สึกและความแข็งแกร่งของตลาด ช่วยให้คุณสังเกตเห็นแนวโน้มที่อาจดำเนินต่อไปหรือกลับตัวได้เพียงแค่การมองผ่านๆ
คุณสมบัติหลัก
-
- 🟢 การวิเคราะห์ปริมาณด้วยภาพ: ระบายสีแท่งราคาทุกแท่งโดยอิงจากการครอบงำของปริมาณซื้อ/ขาย
- 📊 การคำนวณเดลต้าที่ชาญฉลาด: คำนวณเดลต้าปริมาณในช่วงเวลาที่ผู้ใช้กำหนด
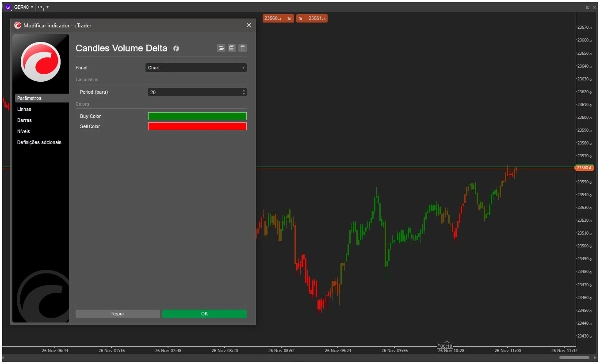
- 🎨 สีที่ปรับแต่งได้: โครงสีซื้อ/ขายที่ปรับได้อย่างเต็มที่
- ⚡ การประมวลผลแบบเรียลไทม์: ปรับแต่งเพื่อให้ตอบสนองทางสายตาทันทีเมื่อมีแท่งใหม่
- 🛠️ การตั้งค่าง่าย: การกำหนดค่าที่เรียบง่ายพร้อมค่าเริ่มต้นที่เหมาะสม
วิธีการทำงาน
Candles Volume Delta วิเคราะห์ปริมาณทิกในช่วงเวลาที่คุณกำหนด (ค่าเริ่มต้น: 20 แท่ง) และคำนวณเปอร์เซ็นต์ของปริมาณซื้อเทียบกับปริมาณขาย:
-
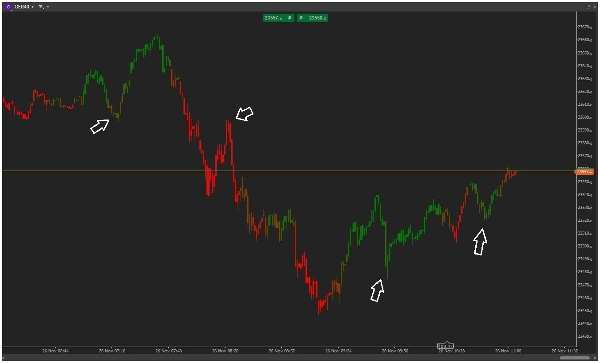
- แท่งสีเขียว: แรงกดดันซื้อสูง (โดยทั่วไป >60% ปริมาณซื้อ)
- แท่งสีแดง: แรงกดดันขายสูง (โดยทั่วไป <40% ปริมาณซื้อ)
- สีไล่ระดับ: การเปลี่ยนสีอย่างนุ่มนวลแสดงระดับความแข็งแกร่งระหว่างกลาง
ตัวบ่งชี้ใช้การปรับความเรียบด้วย ATR เพื่อให้แน่ใจว่าสัญญาณมีความเสถียรและมีความหมายที่ปรับให้เข้ากับความผันผวนของตลาดปัจจุบัน
การประยุกต์ใช้ในการเทรด
-
- การยืนยันแนวโน้ม: ตรวจสอบความแข็งแกร่งของแนวโน้มด้วยการยืนยันปริมาณ
- สัญญาณกลับตัว: สังเกตการกลับตัวที่เป็นไปได้เมื่อการเคลื่อนไหวของราคาขัดแย้งกับการไหลของปริมาณ
- การยืนยันการเบรคเอาท์: ยืนยันการเบรคเอาท์ด้วยหลักฐานปริมาณสนับสนุน
- ความรู้สึกของตลาด: ประเมินการครอบงำของผู้ซื้อ/ผู้ขายโดยรวมในทุกกรอบเวลา
ทำไมต้องใช้ Candles Volume Delta?
แตกต่างจากตัวบ่งชี้ปริมาณที่ซับซ้อนซึ่งทำให้กราฟของคุณรก Candles Volume Delta ให้ข้อมูลตอบกลับทางสายตาทันทีผ่านการระบายสีที่เรียบง่าย มันเบา เร็ว และให้ข้อมูลปริมาณที่จำเป็นโดยไม่ทำให้ข้อมูลล้นหลาม
เหมาะสำหรับเทรดเดอร์ที่ต้องการ:
-
- การประเมินความรู้สึกตลาดอย่างรวดเร็ว
- การวิเคราะห์กราฟที่สะอาด ไม่รก
- การยืนยันการเคลื่อนไหวของราคาอย่างชัดเจน
- การผนวกเข้ากับกลยุทธ์ที่มีอยู่ได้ง่าย
ติดตั้งวันนี้และมองเห็นตลาดผ่านเลนส์ของพลวัตปริมาณ!
สรุป
Key features include customizable color schemes, real-time processing for instant visual feedback, and easy setup with sensible defaults. The indicator helps traders quickly assess market sentiment, confirm trends, identify potential reversals, validate breakouts, and gauge buyer/seller dominance across timeframes. It is designed to provide essential volume insights without cluttering the chart, making it suitable for integration into various trading strategies, including scalping and trend analysis. Supported markets include indices and other instruments where volume analysis is relevant.
รีวิวจากลูกค้า
5 | 100 % | |
4 | 0 % | |
3 | 0 % | |
2 | 0 % | |
1 | 0 % |


