
Nubes_CTrader
อินดิเคเตอร์
2 การซื้อ
เวอร์ชัน 1.0, Jun 2026
Windows, Mac
ตั้งแต่ 10/03/2026
2
การขาย
คำอธิบาย
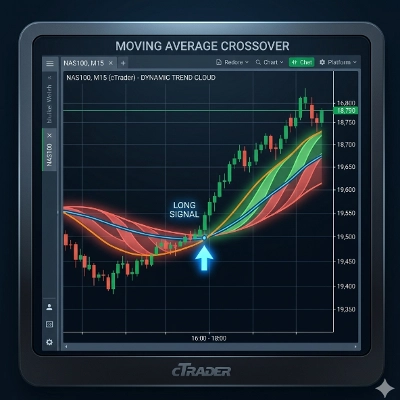
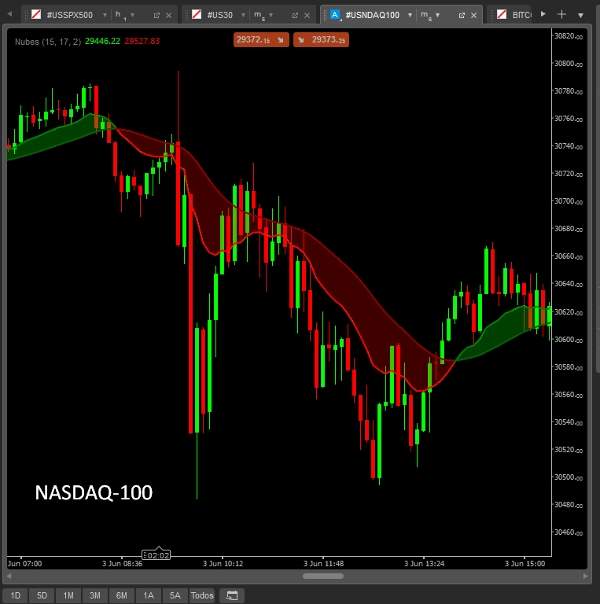
ตัวบ่งชี้เมฆแนวโน้มค่าเฉลี่ยเคลื่อนที่คู่สำหรับ cTrader
รักษาการเทรดของคุณให้สอดคล้องกับแนวโน้มของสถาบันการเงิน ตัวบ่งชี้เมฆแนวโน้มค่าเฉลี่ยเคลื่อนที่คู่ เป็นเครื่องมือภาพขั้นสูงที่ออกแบบมาเพื่อระบุทิศทางตลาดในภาพรวมและตรวจจับโซนที่มีความน่าจะเป็นสูงสำหรับการเข้าซื้อขายแบบดึงกลับหรือดำเนินต่อ
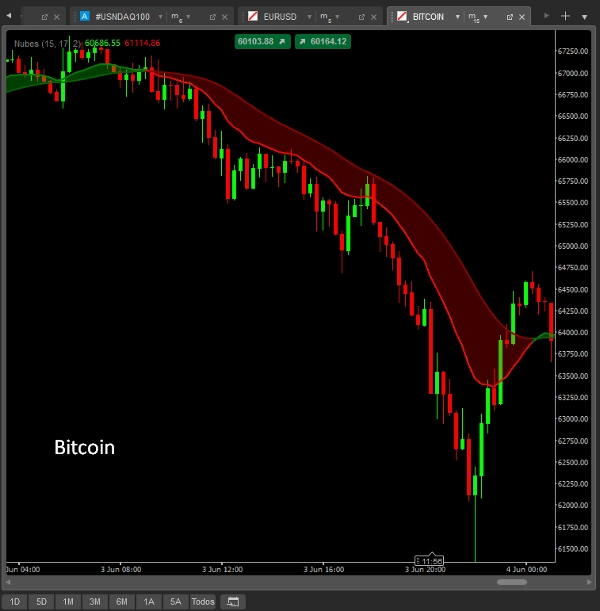
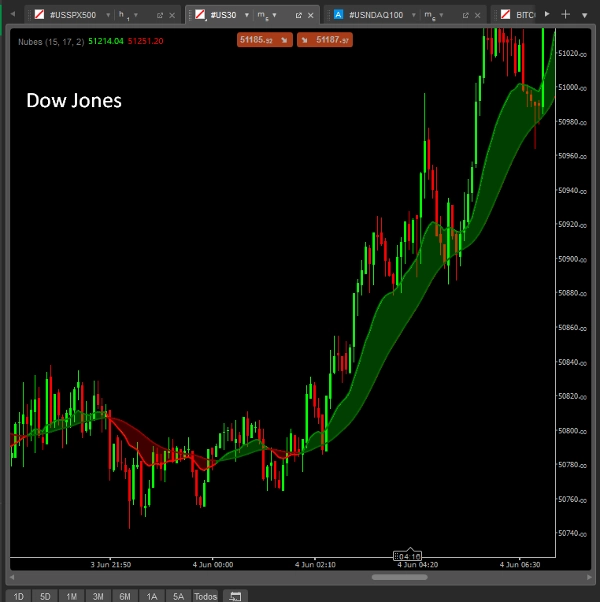
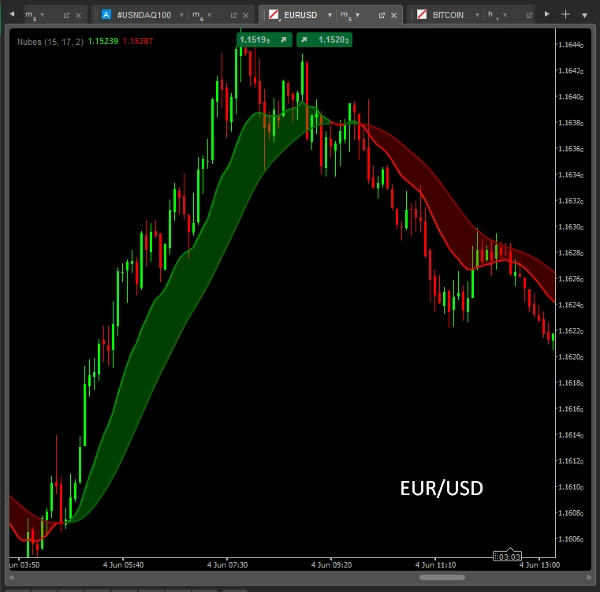
อัลกอริทึมคำนวณและฉายภาพค่าเฉลี่ยเคลื่อนที่สองเส้นพร้อมกัน (ค่าเฉลี่ยเคลื่อนที่มาตรฐานและค่าเฉลี่ยเคลื่อนที่แบบเรียบ) พื้นที่ไดนามิกระหว่างเส้นทั้งสองถูกเติมด้วยเมฆที่เปลี่ยนสีอย่างชาญฉลาดซึ่งช่วยขจัดเสียงรบกวนของตลาดและให้การยืนยันภาพที่ชัดเจนแบบเรียลไทม์
พารามิเตอร์ป้อนข้อมูลที่ปรับแต่งได้ 100%
ควบคุมสูตรคณิตศาสตร์อย่างเต็มที่เพื่อให้เหมาะกับกลยุทธ์เฉพาะของคุณ:
- ช่วงและประเภทของ MA เร็ว: กำหนดช่วงเวลาและวิธีการคำนวณ (ง่าย, เลขชี้กำลัง, เรียบ, ถ่วงน้ำหนักเชิงเส้น ฯลฯ) สำหรับค่าเฉลี่ยเคลื่อนที่เร็ว
- ช่วงและประเภทของ MA ช้า: กำหนดค่าพารามิเตอร์ของค่าเฉลี่ยเคลื่อนที่ช้าเพื่อขยายหรือหดความลึกของเมฆ
- ความโปร่งใสของเมฆที่ปรับแต่งได้: ปรับความทึบและสีได้ง่าย (สีเขียวสำหรับขาขึ้น, สีแดงสำหรับขาลง) เพื่อให้เข้ากับธีมพื้นที่ทำงาน cTrader แบบมืดหรือสว่างของคุณอย่างสมบูรณ์แบบ
วิธีเทรดกับเมฆแนวโน้ม
- ตัวกรองแนวโน้ม (ตามแนวโน้ม): เมื่อเมฆเป็น สีเขียว ความโน้มเอียงคือขาขึ้นและคุณควรให้ความสำคัญกับการตั้งค่าซื้อ เมื่อเมฆเปลี่ยนเป็น สีแดง ความโน้มเอียงคือขาลงและคุณควรมุ่งเน้นที่การตั้งค่าขาย
- โซนดึงกลับ (การเข้าซื้อขายแบบโซน): เมฆไดนามิกทำหน้าที่เป็นพื้นที่สนับสนุนหรือแนวต้านลอยตัว รอให้ราคาทดสอบซ้ำหรือเข้าสู่เมฆโดยไม่ทำลายมัน การปฏิเสธโซนเมฆคือสัญญาณการดำเนินการของคุณ
- ตัวกรองการรวมตัว (การบีบตัว): เมื่อค่าเฉลี่ยเคลื่อนที่ตัดกันบ่อยครั้งและเมฆบางมาก ตัวบ่งชี้จะแจ้งเตือนคุณถึงตลาดที่แบนหรือเคลื่อนไหวในช่วงแคบ ปกป้องคุณจากการหลุดแนวเท็จ
สรุป
สรุปโดย AI
Nubes_CTrader is a dynamic dual moving average cloud indicator designed for the cTrader platform. It simultaneously calculates and displays two moving averages—a Standard MA and a Smoothed MA—creating a color-coded cloud that visually represents market trends and reduces noise. The cloud changes color to indicate bullish (green) or bearish (red) market bias, helping traders identify trend direction in real time.
Key features include fully customizable input parameters for both fast and slow moving averages, allowing users to select period lengths and calculation methods such as Simple, Exponential, Smoothed, or Linear Weighted. The cloud’s transparency and colors can also be adjusted to fit different workspace themes.
The indicator supports multiple trading functions: it acts as a trend filter by signaling buy or sell bias based on cloud color; it identifies pullback zones where price retests the cloud for potential entry points; and it detects consolidation phases when the cloud narrows, warning of ranging markets to avoid false breakouts.
Nubes_CTrader is applicable to any asset and provides visual trend analysis, crossover signals, and pullback entry zones, supporting trading decisions with clear, real-time visual confirmations.
Key features include fully customizable input parameters for both fast and slow moving averages, allowing users to select period lengths and calculation methods such as Simple, Exponential, Smoothed, or Linear Weighted. The cloud’s transparency and colors can also be adjusted to fit different workspace themes.
The indicator supports multiple trading functions: it acts as a trend filter by signaling buy or sell bias based on cloud color; it identifies pullback zones where price retests the cloud for potential entry points; and it detects consolidation phases when the cloud narrows, warning of ranging markets to avoid false breakouts.
Nubes_CTrader is applicable to any asset and provides visual trend analysis, crossover signals, and pullback entry zones, supporting trading decisions with clear, real-time visual confirmations.
โปรไฟล์อินดิเคเตอร์
หมวดหมู่อินดิเคเตอร์
Trend
ประเภทเอาต์พุต
การแสดงเป็นภาพ
สัญญาณ
ข้อกำหนดด้านข้อมูล
แท่งเท่านั้น
สัญญาณที่รองรับ
Cross
Breakout
ความแข็งแกร่งของแนวโน้ม
แตะ Level ที่ระบุ
การสนทนา
รีวิวจากลูกค้า
0.0
รีวิว: 0
รีวิวจากลูกค้า
ยังไม่มีรีวิวสำหรับผลิตภัณฑ์นี้ หากเคยลองแล้ว ขอเชิญมาเป็นคนแรกที่บอกคนอื่น!
คำถามที่พบบ่อย
EMA
Supertrend
AI-assisted
Supply & Demand
Moving Average
Support & Resistance
ผลิตภัณฑ์ที่มีให้บริการผ่าน cTrader Store รวมถึงบอทการเทรด อินดิเคเตอร์ และปลั๊กอิน มีให้บริการโดยนักพัฒนาบุคคลที่สามและมีไว้เพื่อวัตถุประสงค์ในการเข้าถึงข้อมูลและทางเทคนิคเท่านั้น cTrader Store ไม่ใช่โบรกเกอร์และไม่ได้ให้คำแนะนำการลงทุน คำแนะนำส่วนบุคคล หรือการรับประกันผลการดำเนินงานในอนาคต
เพิ่มเติมจากผู้เขียนคนนี้



ราคา
ตั้งแต่ 10/03/2026
2
การขาย