


คำอธิบาย
SMC Smart Money Suite Pro — ชุดเครื่องมือการเคลื่อนไหวราคาสถาบันครบวงจรสำหรับ cTrader
หากคุณเทรดโดยใช้แนวคิดสมาร์ทมันนี่หรือวิธีการเคลื่อนไหวราคาที่มีรากฐานจากกระแสคำสั่งสถาบัน คุณจะรู้ถึงความยุ่งยาก: ตัวชี้วัดหลายสิบตัวกระจัดกระจายอยู่ทั่วแผนภูมิของคุณ แต่ละตัวทำงานได้บางส่วน ไม่มีตัวใดสื่อสารกัน Smart Money Suite Pro ถูกสร้างขึ้นมาเพื่อแก้ปัญหานี้อย่างสมบูรณ์
นี่คือตัวชี้วัดเดียวที่ครบถ้วนในตัวเอง ครอบคลุมทุกแนวคิดหลักภายในวิธีการเคลื่อนไหวราคาสถาบันและสมาร์ทมันนี่ — ออกแบบตั้งแต่ต้นสำหรับ cTrader ปรับแต่งให้ทำงานได้อย่างราบรื่นบนแผนภูมิสดโดยไม่มีการกะพริบ และมาพร้อมฟีเจอร์ที่ช่วยให้ใช้งานได้จริงในช่วงการเทรดจริง
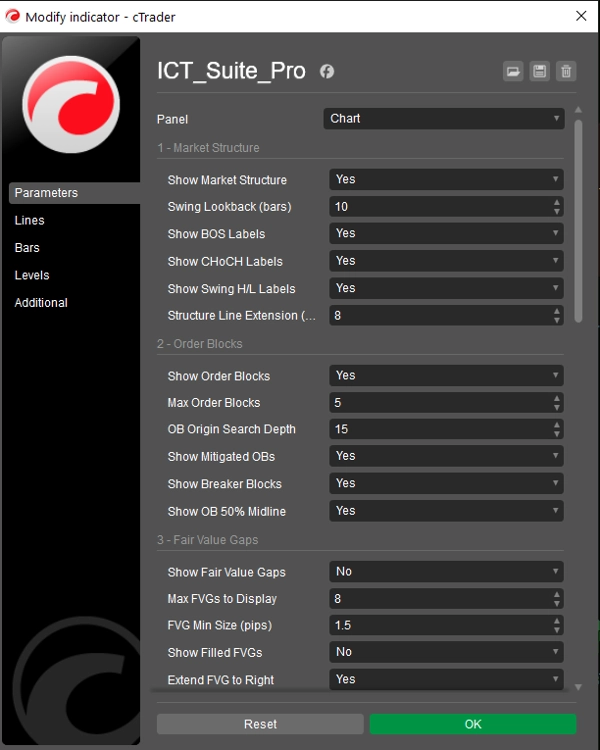
โครงสร้างตลาด — อัตโนมัติและแม่นยำ
ตัวชี้วัดจะสแกนแผนภูมิของคุณอย่างต่อเนื่องเพื่อหาจุดสูงสุดและต่ำสุดที่ได้รับการยืนยัน โดยจัดประเภทแต่ละจุดเป็น Higher High, Lower High, Higher Low หรือ Lower Low การแตกโครงสร้าง (BOS) และการเปลี่ยนแปลงลักษณะ (CHoCH) ทุกครั้งจะถูกตรวจจับและติดป้ายด้วยเส้นระดับแบบจุดเพื่อให้คุณเห็นได้ชัดเจนว่าราคาทะลุโครงสร้างก่อนหน้าในจุดใด ความแตกต่างระหว่าง BOS (แนวโน้มต่อเนื่อง) และ CHoCH (แนวโน้มกลับตัว) ถูกระบุด้วยสีเพื่อให้อ่านได้ทันทีในพริบตา ความลึกของการย้อนดูสวิงสามารถปรับได้อย่างเต็มที่
บล็อกคำสั่ง — พร้อมการติดตามวงจรชีวิตเต็มรูปแบบ
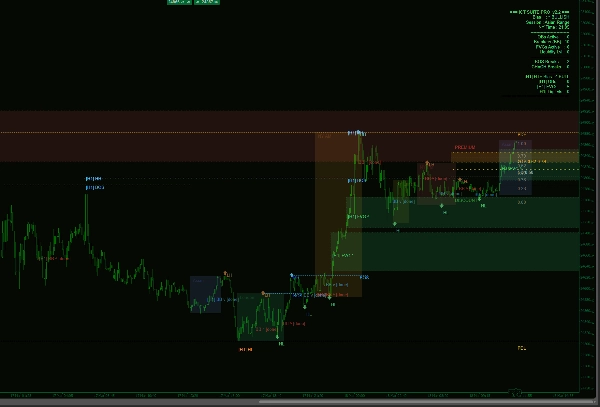
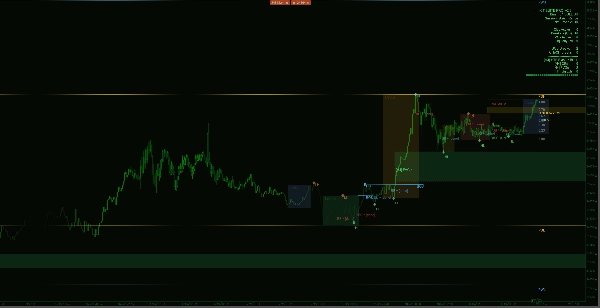
บล็อกคำสั่งถูกระบุโดยการหาค่าแท่งเทียนตรงข้ามสุดท้ายก่อนการเคลื่อนไหวแรงที่นำไปสู่สวิงที่ได้รับการยืนยัน แต่ละบล็อกถูกวาดเป็นกล่องสีที่ยื่นไปทางขวาของแผนภูมิ เพื่อให้คุณเห็นได้ทันทีว่าราคากลับมาที่โซนหรือไม่ เมื่อบล็อกคำสั่งถูกบรรเทา สี่เหลี่ยมจะถูกลบและแทนที่ด้วยเครื่องหมายข้อความจาง ๆ — เพื่อรักษาความสะอาดของแผนภูมิในขณะที่เก็บบันทึกระดับไว้ เมื่อราคาละเมิดผ่านอีกด้านของบล็อกคำสั่งที่ถูกบรรเทา มันจะถูกจัดประเภทใหม่เป็น Breaker Block และเปลี่ยนสี เพื่อสัญญาณโซนกลับตัวที่เป็นไปได้ เส้นกลาง 50% จะถูกวาดภายในแต่ละบล็อกที่ใช้งานเพื่อเน้นการแบ่งพรีเมียม/ส่วนลดภายในโซน
ช่องว่างมูลค่ายุติธรรม — ติดตามจนกว่าจะเติมเต็ม
ความไม่สมดุลของราคาสามแท่งเทียนถูกตรวจจับในทั้งสองทิศทางทั่วทั้งหน้าต่างย้อนดูของคุณ ช่องว่างแต่ละช่องถูกกรองด้วยขนาดพิปขั้นต่ำที่กำหนดได้เพื่อลดเสียงรบกวน ช่องว่างที่ยังไม่เติมจะยืดไปทางขวาของแผนภูมิจนกว่าราคาจะกลับมาปิดช่องว่างเหล่านั้น ซึ่งในจุดนั้นจะถูกลบหรือทำเครื่องหมายว่าเติมเต็มแล้วขึ้นอยู่กับการตั้งค่าของคุณ ทั้งความไม่สมดุลแบบกระทิงและแบบหมีถูกจัดการพร้อมกัน
ระดับสภาพคล่อง — จุดสูงเท่ากันและจุดต่ำเท่ากัน
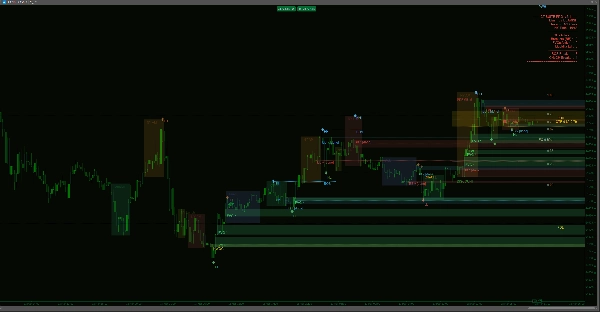
ตัวชี้วัดจะสแกนหากลุ่มของจุดสูงสุดหรือจุดต่ำสุดที่อยู่ภายในความทนทานพิปที่กำหนดได้ของกันและกัน — ระบุแหล่งสภาพคล่องฝั่งซื้อและฝั่งขายที่กระแสคำสั่งสถาบันมักจะมุ่งเป้า แต่ละระดับถูกวาดด้วยเครื่องหมายติ๊กที่จุดสวิงทั้งสองและเส้นประที่ยื่นไปทางขวา เมื่อราคากวาดผ่านระดับสภาพคล่องแล้ว จะถูกซ่อนหรือทำเครื่องหมายว่าถูกกวาดขึ้นอยู่กับความชอบของคุณ
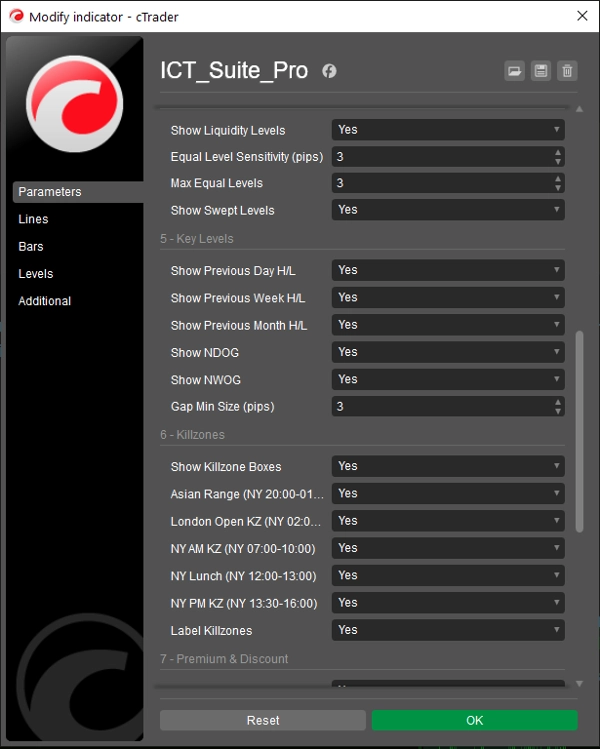
ระดับสำคัญ — วันก่อนหน้า สัปดาห์ก่อนหน้า และเดือนก่อนหน้า
ระดับสูง/ต่ำของวันก่อนหน้า, สัปดาห์ก่อนหน้า, และเดือนก่อนหน้าจะถูกคำนวณโดยอัตโนมัติจากข้อมูลราคาของแผนภูมิของคุณเอง ขอบเขตวันที่ทั้งหมดมาจากเวลาบาร์ของโบรกเกอร์ — ไม่ใช่นาฬิกาของระบบท้องถิ่นของคุณ — ดังนั้นจึงแม่นยำไม่ว่าจะอยู่ในโซนเวลาหรือการเปลี่ยนเครื่องมือใด ๆ คู่ระดับแต่ละคู่ใช้สีและรูปแบบเส้นที่แตกต่างกันเพื่อให้ซ้อนกันได้อย่างสะอาดบนแผนภูมิ
ช่องว่างเปิดตลาด — รายวันและรายสัปดาห์
ตัวชี้วัดจะสแกนการเปิดตลาดรายวันและรายสัปดาห์ทุกครั้งเพื่อหาช่องว่างราคาระหว่างราคาปิดของช่วงก่อนหน้าและราคาเปิดของช่วงปัจจุบัน ช่องว่างใด ๆ ที่เกินขนาดพิปขั้นต่ำที่คุณกำหนดจะถูกวาดเป็นสี่เหลี่ยมสี ช่องว่างเปิดตลาดวันใหม่และสัปดาห์ใหม่จะแยกแยะด้วยสีที่แตกต่างกัน ทำให้คุณเห็นได้ทันทีว่าช่องว่างใดยังไม่ถูกเติมเต็ม
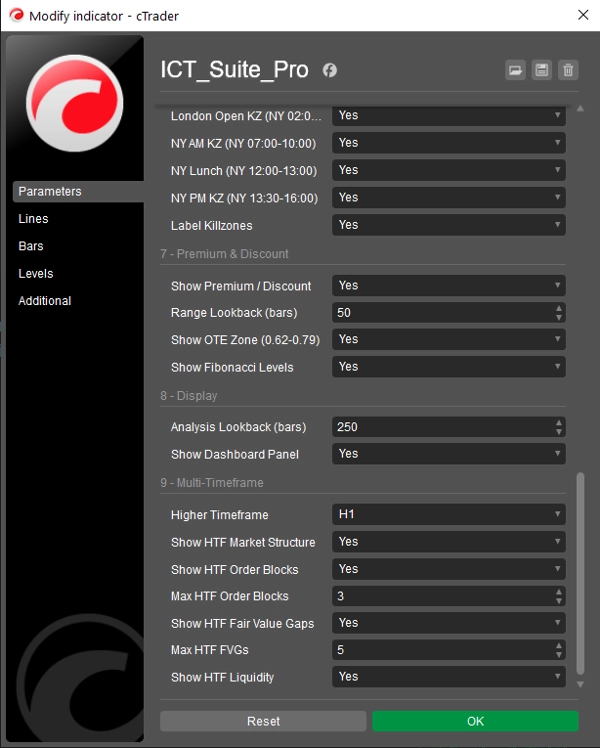
ช่วงเวลาฆ่าเซสชัน — พร้อมกล่องช่วงจริง
ช่วงเวลาเซสชันเอเชีย, เปิดลอนดอน, ช่วงเช้านิวยอร์ก, ช่วงพักกลางวันนิวยอร์ก, และช่วงบ่ายนิวยอร์กถูกวาดเป็นกล่องที่เต็มไปด้วยสีครอบคลุมช่วงราคาสูงสุดถึงต่ำสุดที่เกิดขึ้นจริงในแต่ละช่วงเวลา เวลาอ้างอิงตามเวลานิวยอร์กและปรับอัตโนมัติสำหรับการเปลี่ยนแปลงเวลา EDT/EST กล่องแต่ละกล่องสามารถเปิดปิดและติดป้ายได้อย่างอิสระ เนื่องจากกล่องสะท้อนช่วงราคาจริงแทนที่จะเป็นเส้นแนวตั้งคงที่ คุณจึงเห็นได้ทันทีว่าแต่ละเซสชันมีความเคลื่อนไหวมากน้อยเพียงใดและราคาหาจุดสูงสุดต่ำสุดที่ใด
โซนพรีเมียม & ส่วนลด — พร้อมช่วงเข้าที่เหมาะสม
การวิเคราะห์ช่วงเวลาที่เลื่อนอย่างต่อเนื่องคำนวณจุดสูงสุดสูงและจุดต่ำสุดต่ำสุดในช่วงย้อนดูที่กำหนดได้ จากช่วงนี้ ตัวชี้วัดจะวาดจุดสมดุล (0.50), โซนเข้าที่เหมาะสม (ฟีโบนักชี 0.62–0.79), และชุดระดับฟีโบนักชีที่สำคัญทั้งหมด ป้ายพรีเมียมและส่วนลดถูกวางไว้ภายในช่วงเพื่อให้คุณรู้เสมอว่าราคากำลังซื้อขายในครึ่งใดของช่วงการซื้อขายปัจจุบัน ช่วงย้อนดูถูกจำกัดโดยอัตโนมัติเพื่อให้ตรงกับหน้าต่างแถบที่มองเห็นได้ของคุณ ดังนั้นไม่มีระดับใดอ้างอิงถึงแถบที่คุณไม่เห็น
การซ้อนทับหลายกรอบเวลา — ฟีเจอร์เด่น
ระบบ MTF สร้างแท่งเทียนกรอบเวลาที่สูงขึ้นโดยการรวบรวมแถบของแผนภูมิปัจจุบันเข้าเป็นช่องเวลาที่จัดเรียงอย่างเหมาะสม — ไม่ต้องสมัครข้อมูลแยกต่างหาก เลือกกรอบเวลาที่สูงกว่าของคุณจากเมนูดรอปดาวน์ (M5, M15, M30, H1, H4, D1) และ Smart Money Suite Pro จะคำนวณและวาดบล็อกคำสั่ง, ช่องว่างมูลค่ายุติธรรม, โครงสร้างตลาด, และระดับสภาพคล่องของกรอบเวลาที่สูงกว่าบนแผนภูมิปัจจุบันของคุณโดยตรง รายการกรอบเวลาที่สูงกว่าจะมีความแตกต่างทางสายตา: ขอบหนากว่า, เส้นประ, และป้ายที่มีแท็กกรอบเวลาเป็นคำนำหน้า (เช่น [H4] OB ^) เพื่อให้คุณรู้เสมอว่าระดับนั้นเป็นของกรอบเวลาใด
หากคุณเลือกกรอบเวลาที่สูงกว่าซึ่งเท่ากับหรือต่ำกว่ากรอบเวลาปัจจุบันของแผนภูมิ — ซึ่งเป็นการตั้งค่าที่เป็นไปไม่ได้ — ตัวชี้วัดจะแสดงคำเตือนชัดเจนบนหน้าจอและไม่วาดอะไรเลย เพื่อป้องกันข้อมูลที่ทำให้เข้าใจผิดปรากฏขึ้น
แผงแดชบอร์ดจะอัปเดตด้วยส่วนกรอบเวลาที่สูงกว่าโดยเฉพาะเมื่อการซ้อนทับเปิดใช้งาน แสดงแนวโน้ม HTF, จำนวนบล็อกคำสั่งที่ใช้งาน, จำนวนช่องว่างมูลค่ายุติธรรม, และจำนวนระดับสภาพคล่องควบคู่กับสรุปกรอบเวลาปัจจุบัน
แดชบอร์ดสด
แผงที่สะอาดและยึดติดด้านขวาจะแสดง: แนวโน้มตลาดปัจจุบัน, เซสชันการเทรดที่ใช้งาน, เวลานิวยอร์ก, จำนวนบล็อกคำสั่งที่ใช้งานทั้งหมด, บล็อกเบรกเกอร์, ช่องว่างมูลค่ายุติธรรม, และระดับสภาพคล่อง รวมถึงจำนวนการแตก BOS และ CHoCH ที่ตรวจพบในหน้าต่างย้อนดู เมื่อเปิดใช้งานการซ้อนทับหลายกรอบเวลา สรุปกรอบเวลาที่สูงกว่าจะถูกเพิ่มโดยอัตโนมัติด้านล่าง
สร้างมาเพื่อการเทรดสด
ตัวชี้วัดจะวาดใหม่เฉพาะเมื่อแท่งเทียนใหม่ก่อตัว — ไม่ใช่ทุกครั้งที่มีติ๊กเข้ามา — ช่วยขจัดการกะพริบของแผนภูมิที่ส่งผลต่อตัวชี้วัดแบบ all-in-one หลายตัว การวิเคราะห์ทั้งหมดทำงานภายในหน้าต่างย้อนดูที่กำหนดได้เพื่อให้ประสิทธิภาพคงที่แม้ในกรอบเวลาที่ต่ำกว่าที่มีจำนวนแท่งเทียนมาก
สรุป
รีวิวจากลูกค้า
5 | 50 % | |
4 | 50 % | |
3 | 0 % | |
2 | 0 % | |
1 | 0 % |


!["[Hamster-Coder] Bollinger Bands" โลโก้](https://cdn.ctrader.com/image/webp/21d8e5d6-fb11-4bac-b9ee-cd05c2b76804_30327)


