คำอธิบาย
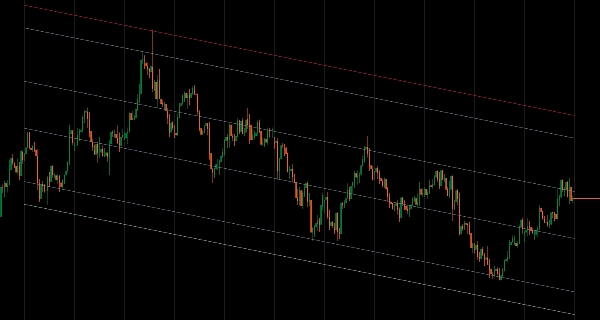
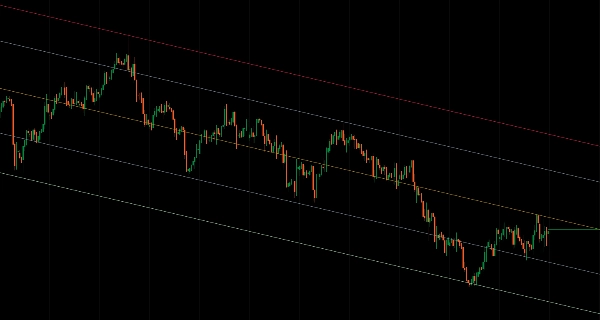
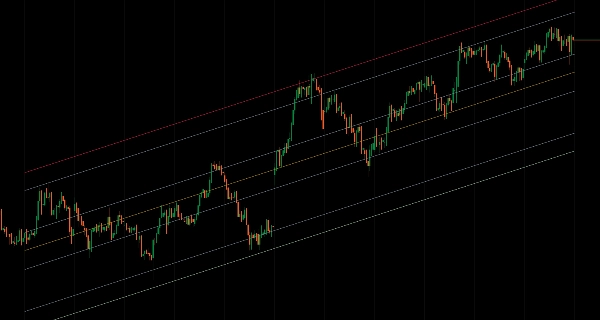
ช่องราคาทางสถิติที่มีโหมดการคำนวณที่ยืดหยุ่นและการแสดงแถบที่อิงจากความเบี่ยงเบน
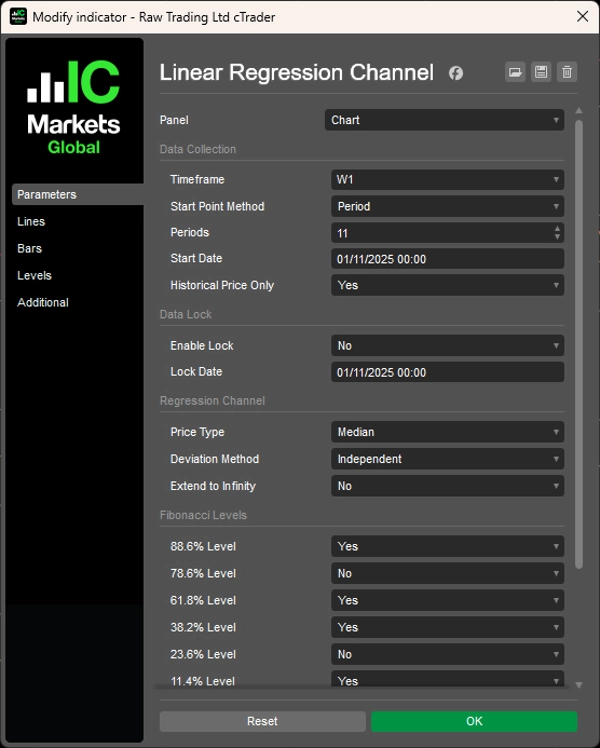
เหมาะกับเส้นถดถอยผ่านข้อมูลราคาโดยใช้โหมดช่วงเวลา (แท่ง N ล่าสุด), โหมดวันที่และเวลา (จากวันที่เฉพาะเจาะจง) หรือกลไกล็อกเพื่อหยุดการวิเคราะห์ที่จุดประวัติศาสตร์ในขณะที่ราคายังคงดำเนินต่อไป
สามวิธีการเบี่ยงเบน (เฉลี่ย, อิสระ, สูงสุด) สำหรับช่องสมมาตรและไม่สมมาตร, หกระดับ Fibonacci retracement (11.4% ถึง 88.6%), การวิเคราะห์หลายกรอบเวลา, หกประเภทราคา (เปิด/สูง/ต่ำ/ปิด/ค่ากลาง/ค่าปกติ), โหมดเฉพาะประวัติศาสตร์สำหรับการทดสอบย้อนหลังที่เสถียร และการฉายภาพขยายไปจนถึงอนันต์ มอบการวิเคราะห์ถดถอยที่ครอบคลุมสำหรับผู้ค้าเป้าหมายโซนการกลับสู่ค่าเฉลี่ยและขอบเขตราคาทางสถิติในสภาวะตลาดต่างๆ
คุณสมบัติ
การเลือกข้อมูลที่ยืดหยุ่น
- โหมดช่วงเวลา: วิเคราะห์แท่ง N ล่าสุด (เช่น แท่งเทียนรายเดือน 12 แท่งล่าสุด)
- โหมดวันที่และเวลา: เริ่มจากเหตุการณ์ตลาดหรือวันที่เฉพาะเจาะจง
- กลไกล็อก: หยุดการวิเคราะห์ที่จุดประวัติศาสตร์ในขณะที่ราคายังคงดำเนินต่อไป
- หลายกรอบเวลา: วาดเส้นถดถอยจากกรอบเวลาใดก็ได้บนแผนภูมิปัจจุบันของคุณ
วิธีการเบี่ยงเบนอัจฉริยะ
- เฉลี่ย: ระดับที่สมดุลโดยใช้ความเบี่ยงเบนเฉลี่ย—เหมาะสำหรับโซนการซื้อขาย
- อิสระ: ช่องไม่สมมาตรที่ปรับตัวตามความผันผวนในทิศทาง
- สูงสุด: แสดงขอบเขตราคาสูงสุดสำหรับการวิเคราะห์ช่วงเต็ม
เครื่องมือวิเคราะห์ระดับมืออาชีพ
- 6 ระดับ Fibonacci retracement (11.4%, 23.6%, 38.2%, 61.8%, 78.6%, 88.6%)
- 6 ประเภทราคา: เปิด, สูง, ต่ำ, ปิด, ค่ากลาง, ปกติ
- โหมดเฉพาะประวัติศาสตร์: ไม่รวมแท่งที่กำลังสร้างสำหรับการทดสอบย้อนหลังที่เสถียร
- ตัวเลือกขยายไปจนถึงอนันต์สำหรับการฉายภาพระยะยาว
การปรับแต่งเต็มรูปแบบ
- ปรับแต่งสีได้ครบถ้วนสำหรับองค์ประกอบช่องทั้งหมด
- ควบคุมเส้นถดถอยและแถบเบี่ยงเบนแยกกัน
- การนำเสนอภาพที่สะอาดตาสำหรับการวิเคราะห์ที่เน้น
ความสามารถขั้นสูง
- ฟีเจอร์ล็อกสำหรับการศึกษาการวิเคราะห์ตามเหตุการณ์
- รวมโครงสร้างกรอบเวลาที่สูงกว่ากับการดำเนินการในกรอบเวลาที่ต่ำกว่า
- ตัวเลือกช่องสมมาตรและไม่สมมาตรสำหรับสภาวะตลาดที่แตกต่างกัน
__________________________________________________________________________________________
ตัวชี้วัดฟรีเพิ่มเติม
สำรวจเครื่องมือวิเคราะห์ตลาดหลากหลายประเภท—ตั้งแต่โครงสร้างและปริมาณไปจนถึงถดถอย, ความผันผวน และกรอบเวลาที่กำหนดเอง
ซอร์สโค้ดมีให้ใน ที่เก็บบน GitHub.
ทั้งหมดใช้ฟรี แต่ถ้าคุณต้องการสนับสนุนด้วยกาแฟ คุณสามารถส่งได้ ที่นี่.
แนวรับ/แนวต้าน
ปริมาณ
- โปรไฟล์กิจกรรมปริมาณ
- ตัววิเคราะห์ประสิทธิภาพปริมาณ
- การวิเคราะห์โปรไฟล์ปริมาณ
- โปรไฟล์ปริมาณ - อัปเดต
- การวิเคราะห์การกระจายปริมาณ
- VWAP (ราคาเฉลี่ยถ่วงน้ำหนักด้วยปริมาณ)
ค่าเฉลี่ยเคลื่อนที่
- ช่อง SSL
- ค่าเฉลี่ยเคลื่อนที่แบบยึดจุด
- ค่าเฉลี่ยเคลื่อนที่ที่ปรับขนาดด้วยความเบี่ยงเบน
- ตัวกระตุ้นสูงต่ำแบบแกนน์
- เส้นแนวโน้มทันที
- ค่าเฉลี่ยเคลื่อนที่แบบปรับตัวของ Kaufman พร้อมวิสัยทัศน์แนวโน้ม
- ช่องค่าเฉลี่ยเคลื่อนที่
- ชุดค่าเฉลี่ยเคลื่อนที่
- ค่าเฉลี่ยเคลื่อนที่ช่องแนวโน้ม
ยูทิลิตี้/กำหนดเอง
อิงถดถอย
ความผันผวน
ออสซิลเลเตอร์
__________________________________________________________________________________________
ข้อจำกัดความรับผิดชอบ
การซื้อขายมีความเสี่ยง ตัวชี้วัดนี้มีไว้สำหรับการวิเคราะห์ทางเทคนิคเท่านั้น — โปรดใช้การจัดการความเสี่ยงที่เหมาะสมและซื้อขายอย่างรับผิดชอบเสมอ
คำติชมและการปรับปรุง
หากคุณมีข้อเสนอแนะ คำขอคุณสมบัติ หรือไอเดียสำหรับการปรับปรุง โปรดแสดงความคิดเห็นในแท็บอภิปราย คำติชมของคุณช่วยปรับปรุงตัวชี้วัดสำหรับทุกคน
สรุป
รีวิวจากลูกค้า
5 | 100 % | |
4 | 0 % | |
3 | 0 % | |
2 | 0 % | |
1 | 0 % |


!["[Hamster-Coder] Pivot Points MTF" โลโก้](https://cdn.ctrader.com/image/webp/4c143e5a-309c-40e3-a578-f04d1e133ffa_31159)