

Descrizione
VERSIONE AGGIORNATA DEL PROFILO VOLUME
Rispetto alla versione precedente, questa versione aggiornata include correzioni di bug critici, nuove funzionalità e significativi miglioramenti delle prestazioni:
Correzioni
- Correzione della distribuzione del volume: allocazione proporzionale basata sulla sovrapposizione delle candele invece del 100% su tutti i livelli toccati
- Correzione del rilevamento VAH/VAL: la tolleranza scala con l'altezza del livello invece di un valore codificato
- Correzione del posizionamento del testo: offset dinamici basati sul timeframe invece di giorni codificati
- Correzione della validazione DateTime: controllo barre vuote, validazione fuori intervallo
Funzionalità
- Aggiunto parametro Offset Fuso Orario per i profili DateTime
- Aggiunto parametro Posizione Testo (Sinistra/Destra) per la modalità lookback
- Le etichette della modalità DateTime ora seguono i bordi delle barre (larghezza variabile) o si allineano al bordo del profilo (larghezza completa)
Prestazioni
- Ricerca binaria per la ricerca dell'indice DateTime (prima era lineare O(n))
- Calcolo del volume totale memorizzato nella cache (prima ricalcolato per ogni livello)
- Dizionario TPO pre-dimensionato per evitare ridimensionamenti
- Pattern TryGetValue per ricerche nel dizionario
- Cicli basati su indice che sostituiscono foreach nei percorsi critici
Pulizia
- Rimosso parametro ProfileWidth (il calcolo automatico è sempre corretto)
- Semplificata l'intersezione delle candele in una singola condizione
__________________________________________________________________________________________
NOTE IMPORTANTI - LEGGERE PRIMA
Il Volume Forex Non È Volume Reale
Il volume nel forex è volume tick — conta quante volte il prezzo cambia. NON conta quanti soldi sono stati scambiati.
Cosa il Volume Tick Non Può Mostrare
- Dimensione della transazione. Una transazione da $100 e una da $10.000.000 contano entrambe come 1 tick.
- Flusso di denaro reale. Non puoi vedere se il prezzo è stato mosso da grandi o piccoli investitori.
- Vera liquidità. Non puoi vedere quante ordini sono in attesa sul mercato.
- Attività bancaria. Le banche vedono i dati di volume reale. Tu no.
Cosa Significa Questo
Il volume tick mostra solo quante volte il prezzo è cambiato — non i soldi dietro. Questo crea problemi:
- Non puoi tracciare banche o istituzioni. Usano dati di volume reale a cui non hai accesso.
- Non puoi dimostrare teorie di "smart money". Queste idee richiedono volume reale, non conteggi tick.
- Non puoi giudicare la vera liquidità. L'attività tick non mostra la profondità degli ordini o la reale forza del mercato.
- Non puoi misurare il vero potere di acquisto o vendita. Molte piccole transazioni sembrano uguali a una grande transazione istituzionale.
- I picchi di volume possono ingannare. Un picco potrebbe essere solo rumore algoritmico, non reale interesse di trading.
Come Usare Correttamente Questo Indicatore
- Consideralo un misuratore di attività, non di denaro. Alto volume tick = mercato attivo. Basso volume tick = mercato tranquillo. Nient'altro.
- Confronta l'attività tra diversi momenti. Usalo per vedere: la sessione di Londra è più attiva di New York? Oggi è più attivo di ieri? Il periodo di trend è più attivo della consolidazione?
- Combinalo con la struttura del prezzo. Usa supporti/resistenze, punti di swing o BOS/ChoCH insieme al volume. Il contesto del prezzo previene falsi segnali da picchi di volume rumorosi.
- Osserva l'attività a livelli di prezzo importanti. Quando il prezzo testa un livello chiave e il volume tick aumenta, significa che più trader sono attivi. NON significa che grandi operatori siano coinvolti.
- Non presumere che mostri attività istituzionale. Il volume tick non può mostrare accumulo, grandi ordini o "smart money". Usalo solo per misurare ritmo e tempo.
__________________________________________________________________________________________
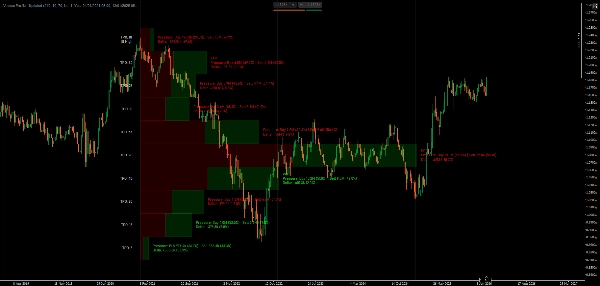
Visualizza la distribuzione del volume e il tempo trascorso al prezzo con POC, Area di Valore e tracciamento Market Profile TPO.
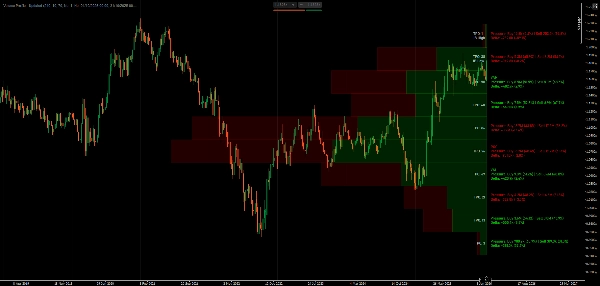
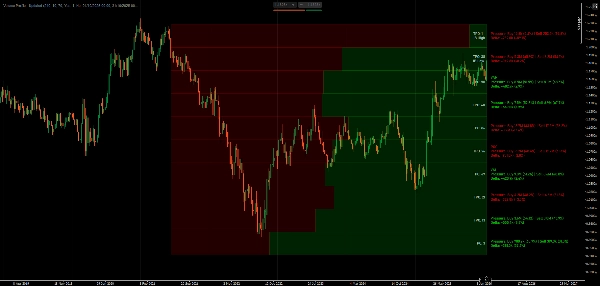
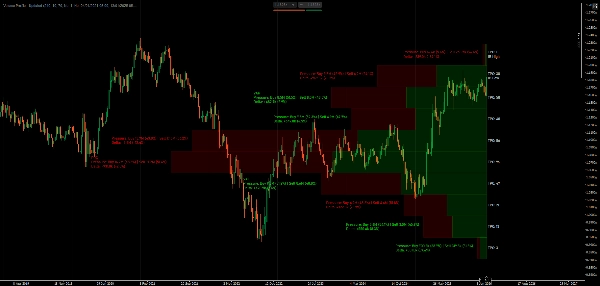
Questo indicatore mostra la distribuzione del volume usando i concetti di Market Profile. Visualizza il Punto di Controllo (livello di attività tick più alto), i confini dell'Area di Valore (dove si è svolto il maggior trading), le sequenze di lettere TPO (tempo trascorso a ogni prezzo) e la visualizzazione delta che divide l'attività tick per direzione della candela.
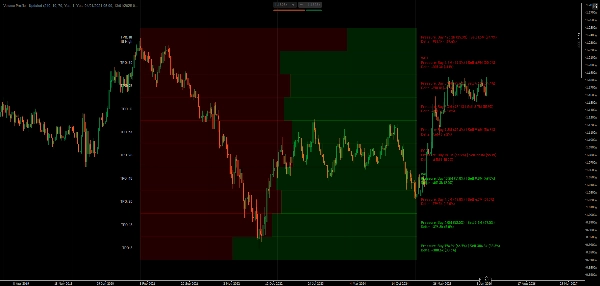
Puoi scegliere periodi di lookback o impostare intervalli di date specifici, visualizzare le barre di volume come proporzionali o a larghezza completa, passare tra tutti i livelli o solo i livelli chiave, e personalizzare i colori per attività rialzista/ribassista.
FUNZIONALITÀ
Analisi della Distribuzione del Volume
- Punto di Controllo (POC): Livello di prezzo con la massima attività—dove il prezzo ha trascorso più tempo
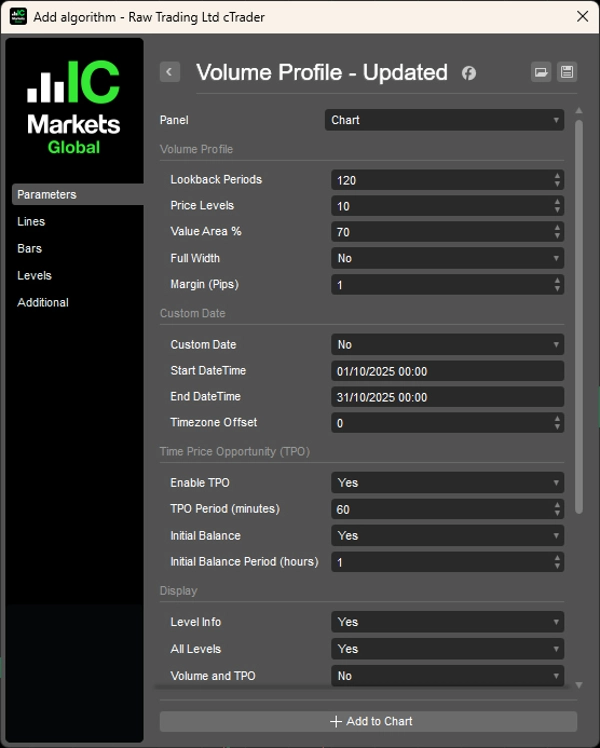
- Area di Valore (VA): Zona di concentrazione dell'attività personalizzabile (default 70%)—dove si è svolto il maggior trading
- VAH/VAL: Confini Area di Valore Alta/Bassa—potenziali livelli di supporto/resistenza
- Visualizzazione Delta: Le barre divise mostrano la direzione della candela a ogni livello di prezzo
Market Profile TPO
- Tracciamento Time Price Opportunity: Conta quanti periodi di tempo sono stati scambiati a ogni prezzo
- Lettere TPO: Rappresentazione visiva del tempo trascorso al prezzo (sequenza A-Z)
- Bilancio Iniziale (IB): Intervallo della prima ora—importante per la struttura del day trading
- Marcatori IB Alto/Basso: Estremi dell'intervallo di apertura
Opzioni di Lookback Flessibili
- Basato su periodo: Imposta il numero di barre da analizzare (es. ultime 120 barre)
- Intervallo DateTime: Ancoraggio del profilo tra date/ore specifiche per analisi di eventi
- Larghezza dinamica: Profili a scala automatica o larghezza fissa
Opzioni di Visualizzazione
- Barre di Volume: larghezza proporzionale (scala attività) o barre uniformi a larghezza completa
- Divisione della direzione della candela all'interno di ogni barra
- Calcoli delta con percentuali
- Alterna tutti i livelli o solo i livelli chiave (POC, VAH, VAL)
- Controllo della visibilità dei dettagli Volume/TPO
- Suddivisione direzionale con percentuali
- Dimensione del font e margini basati su pip regolabili
Personalizzazione Colori
- Colori indipendenti per barre direzionali rialziste/ribassiste
- Colori testo separati per delta positivo/negativo
- Colore testo specifico per TPO
Prestazioni Ottimizzate
- Ricerche temporali memorizzate nella cache e disegno efficiente dei rettangoli
- Ricalcolo minimo per prestazioni fluide
- Calcolo delta di livello professionale basato sulla struttura della candela
__________________________________________________________________________________________
ALTRI INDICATORI GRATUITI
Esplora una vasta gamma di strumenti di analisi di mercato—dalla struttura e volume alla regressione, volatilità e timeframe personalizzati.
Il codice sorgente è disponibile nel repository GitHub.
Tutti gratuiti da usare. Ma se vuoi offrire un supporto per un caffè, puoi farlo qui.
Supporto/Resistenza
Volume
- Volume Activity Profiler
- Volume Efficiency Analyzer
- Volume Profile Analytics
- Volume Profile - Aggiornato
- Volume Spread Analysis
- VWAP (Prezzo Medio Ponderato per Volume)
Medie Mobili
- SSL Channel
- Media Mobile Ancorata
- Media Mobile Scalata per Deviazione
- Gann High Low Activator
- Linea di Tendenza Istantanea
- Media Mobile Adattiva di Kaufman con Trend Vision
- Canale Media Mobile
- Suite Medie Mobili
- Media Mobile Canale di Trend
Utility/Personalizzati
Basato su Regressione
Volatilità
Oscillatori
__________________________________________________________________________________________
DICHIARAZIONE DI NON RESPONSABILITÀ
Il trading comporta rischi. Questo indicatore è destinato solo all'analisi tecnica — applica sempre una corretta gestione del rischio e opera responsabilmente.
FEEDBACK E MIGLIORAMENTI
Se hai suggerimenti, richieste di funzionalità o idee per miglioramenti, lascia un commento nella scheda Discussione. Il tuo feedback aiuta a migliorare l'indicatore per tutti.
Riepilogo
Key features include customizable lookback periods based on bar count or specific date/time ranges, dynamic or fixed profile widths, and display options for proportional or full-width volume bars. Users can toggle visibility of all levels or key levels (POC, VAH, VAL) and adjust colors independently for bullish/bearish bars and delta text. The indicator tracks Initial Balance (IB) ranges and marks IB High/Low for day trading structure.
Performance optimizations include binary search for DateTime lookups, cached volume calculations, and efficient data structures to minimize recalculations. The indicator uses tick volume, which counts price changes rather than actual traded volume, making it suitable as a market activity meter rather than a measure of real money flow or liquidity.
Supported markets include Forex, Indices, Commodities, Crypto, and Stocks. The indicator is intended for technical analysis and includes parameters for timezone offset and text positioning.
Recensioni dei clienti
5 | 100 % | |
4 | 0 % | |
3 | 0 % | |
2 | 0 % | |
1 | 0 % |

Discussioni
Domande frequenti
Altro da questo autore






















Prezzo