
Penerangan
TINJAUAN
Analisis Sebaran Isipadu (VSA) adalah metodologi yang dibangunkan oleh Tom Williams, seorang bekas pedagang sindiket, berdasarkan kerja Richard Wyckoff dari awal 1900-an. VSA mentafsirkan hubungan antara isipadu, julat harga (sebaran), dan lokasi penutupan untuk mengenal pasti ketidakseimbangan bekalan dan permintaan.
Konsep Utama VSA:
- Isipadu menunjukkan jumlah aktiviti - siapa yang mengambil bahagian
- Sebaran menunjukkan volatiliti dan ketidakpastian - sejauh mana harga bergerak
- Lokasi Penutupan menunjukkan siapa yang menang bar - pembeli atau penjual
- Konteks menunjukkan di mana kita berada dalam kitaran pasaran - fasa kekuatan atau kelemahan
Apabila isipadu meningkat dengan sebaran luas tetapi kemajuan harga sedikit, ia mencadangkan penyerapan (satu pihak menyerap tekanan pihak lain). Apabila isipadu menurun dengan sebaran sempit dalam trend, ia mencadangkan kekurangan penyertaan (kelemahan berpotensi).
Pelaksanaan Ini:
Penunjuk ini mengkuantifikasi konsep VSA menggunakan kaedah statistik. Ia berbeza daripada VSA tradisional dalam beberapa cara:
- Menggunakan
(close - open) / rangesebagai metrik kecekapan (tidak terdapat dalam VSA asal) - Corak penyerapan mengenal pasti "satu pihak menang" dan bukannya "penyerapan tekanan" tradisional
- ENR (Usaha Tanpa Hasil) dikira menggunakan ambang kecekapan; VSA asal lebih interpretatif
- Menggunakan purata terpotong untuk purata isipadu (tahan anomali) dan peringkat peratusan untuk sebaran
- Tidak termasuk: Isipadu Berhenti, Upthrust, Ujian, corak Shakeout
Ini adalah pendekatan berangka dan algoritma kepada konsep VSA. VSA tradisional lebih interpretatif dan bergantung pada konteks. Gunakan penunjuk ini sebagai salah satu alat analisis di antara banyak, bukan sebagai isyarat berdiri sendiri.
APA YANG DILAKUKAN PENUNJUK INI
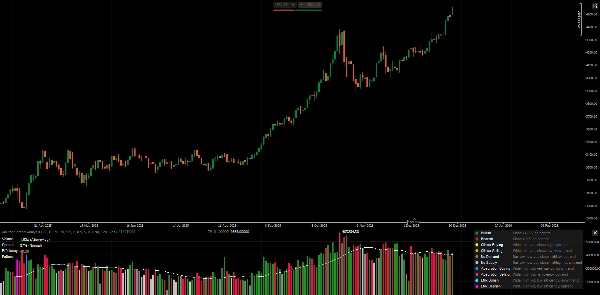
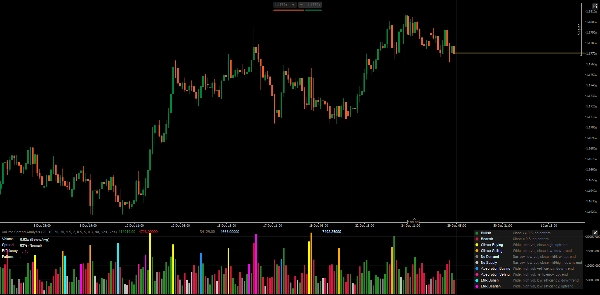
Menganalisis isipadu, sebaran, dan lokasi penutupan setiap bar untuk mengesan ketidakseimbangan bekalan/permintaan yang berpotensi. Memaparkan histogram isipadu berwarna mengikut jenis corak, dengan panel metrik masa nyata.
TAHAPAN CORAK
1. Bar Standard (Tiada Corak)
- Bullish: Penutupan ≥ 0.5 dalam julat, tiada corak khas dikesan
- Bearish: Penutupan < 0.5 dalam julat, tiada corak khas dikesan
2. Corak Klimaks (Kemungkinan Keletihan)
- Pembelian Klimaks: Sebaran luas + isipadu sangat tinggi + penutupan tinggi + dalam trend menaik
-
- Tafsiran: Kemungkinan keletihan pembelian, perhatikan pembalikan
- Penjualan Klimaks: Sebaran luas + isipadu sangat tinggi + penutupan rendah + dalam trend menurun
-
- Tafsiran: Kemungkinan keletihan penjualan, perhatikan pembalikan
3. Corak Lemah (Kekurangan Keyakinan)
- Tiada Permintaan: Sebaran sempit + isipadu rendah + penutupan tengah/rendah + dalam trend menaik
-
- Tafsiran: Pembeli tidak menyokong rally, kelemahan berpotensi
- Tiada Bekalan: Sebaran sempit + isipadu rendah + penutupan tengah/tinggi + dalam trend menurun
-
- Tafsiran: Penjual tidak menolak harga lebih rendah, kekuatan berpotensi
4. Corak Penyerapan (Satu Pihak Menang)
- Penyerapan Pembelian: Sebaran luas + isipadu tinggi + kecekapan positif + dalam trend menurun
-
- Tafsiran: Pembeli menyerap tekanan jualan, pembalikan naik berpotensi
- Penyerapan Penjualan: Sebaran luas + isipadu tinggi + kecekapan negatif + dalam trend menaik
-
- Tafsiran: Penjual menyerap tekanan pembelian, pembalikan turun berpotensi
5. Corak ENR (Usaha Tanpa Hasil Jelas)
- ENR Bullish: Sebaran luas + isipadu tinggi + kecekapan rendah + dalam trend menurun
-
- Tafsiran: Usaha tinggi tetapi tiada pemenang jelas, sokongan/ketidakpastian berpotensi
- ENR Bearish: Sebaran luas + isipadu tinggi + kecekapan rendah + dalam trend menaik
-
- Tafsiran: Usaha tinggi tetapi tiada pemenang jelas, rintangan/ketidakpastian berpotensi
PANEL METRIK DIJELASKAN
Isipadu
- Menunjukkan isipadu bar semasa sebagai nisbah kepada purata terpotong (contoh, "1.85x")
- Klasifikasi: Rendah / Di Bawah Purata / Di Atas Purata / Tinggi / Sangat Tinggi
- Isipadu tinggi = penyertaan pasaran, tetapi konteks penting
Sebaran
- Menunjukkan kedudukan peratusan (0-100%) berbanding bar terkini
- Klasifikasi: Sempit / Normal / Luas
- Sebaran luas = volatiliti/ketidakpastian, bukan semestinya arah
Kecekapan
- Formula:
(close - open) / (high - low) - Julat: -1.0 hingga +1.0
- Positif = badan bullish menguasai julat
- Negatif = badan bearish menguasai julat
- Hampir sifar = badan kecil, sumbu tinggi, ketidakpastian
Corak
- Corak dikesan semasa (atau "-" jika tiada)
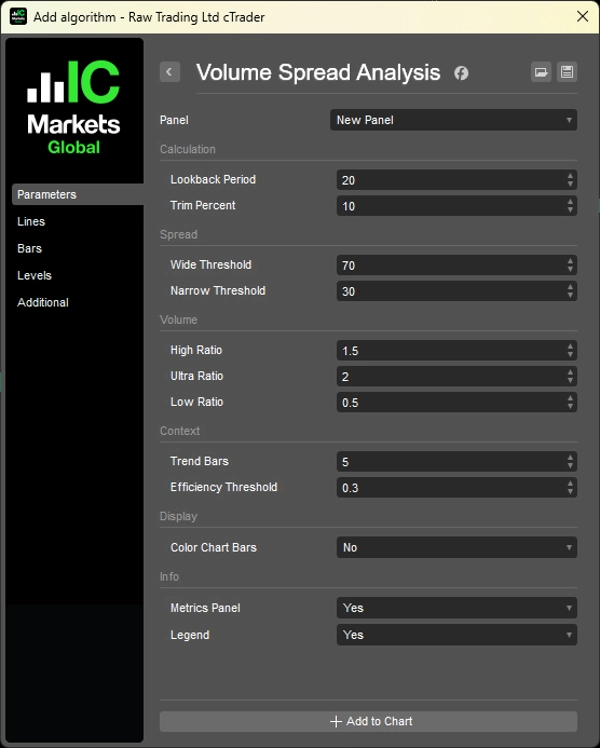
PARAMETER
1. Pengiraan
- Tempoh Lihat Kembali (20): Bar yang digunakan untuk statistik isipadu/sebaran
- Peratus Potong (10%): Mengeluarkan nilai luar biasa dari pengiraan isipadu
2. Klasifikasi Sebaran
- Ambang Luas (70%): Peratusan untuk mengklasifikasikan sebagai "luas"
- Ambang Sempit (30%): Peratusan untuk mengklasifikasikan sebagai "sempit"
3. Klasifikasi Isipadu
- Nisbah Tinggi (1.5x): Ambang di atas purata
- Nisbah Ultra (2.0x): Ambang sangat tinggi
- Nisbah Rendah (0.5x): Ambang di bawah purata
4. Konteks
- Bar Trend (5): Bar kembali untuk membandingkan arah trend
- Ambang Kecekapan (0.3): Minimum untuk kecekapan "kuat"
5. Paparan
- Warna Bar Carta: Terapkan warna corak pada carta harga
- Panel Metrik: Papar metrik masa nyata
- Legenda: Papar panduan rujukan corak
CARA MENGGUNAKAN
1. Jangan gunakan corak sebagai isyarat dagangan langsung - ia menunjukkan konteks berpotensi, bukan kemasukan.
2. Gabungkan dengan struktur harga - VSA berfungsi terbaik mengesahkan apa yang ditunjukkan oleh struktur harga.
3. Perhatikan konteks - corak yang sama boleh bermakna perkara berbeza pada sokongan berbanding rintangan.
4. Perspektif isipadu penting - penyerapan isipadu tinggi pada tahap utama > penyerapan bar rawak.
Had Isipadu Forex
Pasaran spot Forex menunjukkan isipadu tick (bilangan perubahan harga), bukan kontrak sebenar yang didagangkan. Corak mungkin kurang boleh dipercayai berbanding dalam niaga hadapan/saham dengan data isipadu sebenar.
LEGENDA (Rujukan Terbina Dalam)
Aktifkan parameter "Legenda" untuk memaparkan penerangan corak terus pada carta.
__________________________________________________________________________________________
LAGI PENUNJUK PERCUMA
Terokai pelbagai alat analisis pasaran—daripada struktur dan isipadu hingga regresi, volatiliti, dan jangka masa tersuai.
Kod sumber tersedia di repositori GitHub ini.
Semua percuma untuk digunakan. Tetapi jika anda ingin menyokong dengan kopi, anda boleh salurkan ia di sini.
Sokongan/Rintangan
Isipadu
- Profiler Aktiviti Isipadu
- Penganalisis Kecekapan Isipadu
- Analitik Profil Isipadu
- Profil Isipadu - Dikemas Kini
- Analisis Sebaran Isipadu
- VWAP (Harga Purata Berwajaran Isipadu)
Purata Bergerak
- Saluran SSL
- Purata Bergerak Berangkai
- Purata Bergerak Skala Penyimpangan
- Pengaktif Tinggi Rendah Gann
- Garis Trend Segera
- Purata Bergerak Adaptif Kaufman dengan Visi Trend
- Saluran Purata Bergerak
- Set Purata Bergerak
- Purata Bergerak Saluran Trend
Utiliti/Tersuai
Berasaskan Regresi
Volatiliti
Osilator
__________________________________________________________________________________________
PENAFIAN
Perdagangan melibatkan risiko. Penunjuk ini bertujuan untuk analisis teknikal sahaja — sentiasa gunakan pengurusan risiko yang betul dan berdagang dengan bertanggungjawab.
MAKLUMBALAS & PENAMBAHBAIKAN
Jika anda mempunyai cadangan, permintaan ciri, atau idea untuk penambahbaikan, sila tinggalkan komen di tab Perbincangan. Maklum balas anda membantu memperbaiki penunjuk untuk semua orang.
Ringkasan
This implementation quantifies VSA concepts using statistical methods, including an efficiency metric defined as (close - open) / range, trimmed mean volume averaging, and percentile ranking for spread. It identifies several bar patterns: Standard (bullish/bearish), Climax (buying/selling exhaustion), Weak (No Demand/No Supply), Absorption (one side winning), and ENR (Effort No Result), each indicating different market conditions.
The indicator displays a volume histogram colored by detected pattern type and provides a real-time metrics panel showing volume ratio, spread percentile, efficiency, and current pattern. Parameters allow customization of lookback periods, volume/spread thresholds, and display options such as coloring chart bars and showing a pattern legend.
VSA is applicable across markets including Forex, stocks, indices, commodities, and crypto. Note that Forex volume reflects tick volume, which may affect pattern reliability. The indicator is designed as an analytical tool to complement price structure analysis rather than as standalone trade signals.
Ulasan pelanggan
5 | 100 % | |
4 | 0 % | |
3 | 0 % | |
2 | 0 % | |
1 | 0 % |


![Logo "Gaussian Channel [Iridio Capital]"](https://cdn.ctrader.com/image/webp/7c039209-5573-4a54-a072-f9528b503103_41960)


