Descrizione
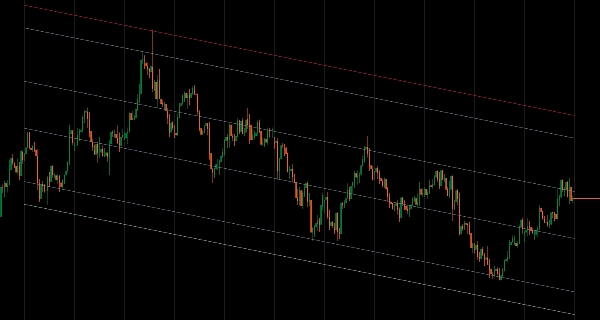
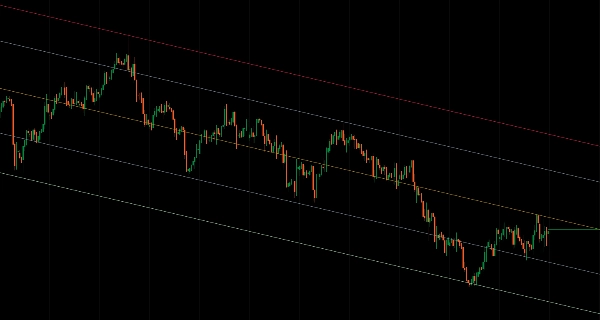
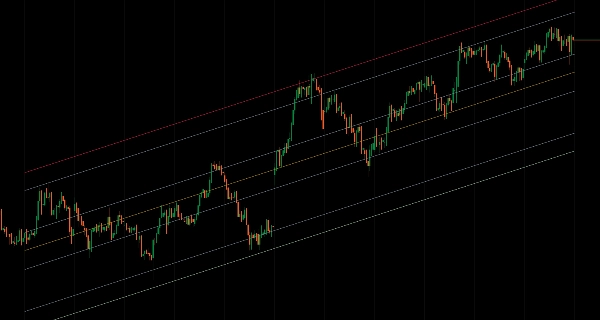
Canali di prezzo statistici con modalità di calcolo flessibili e rendering delle bande basato sulla deviazione.
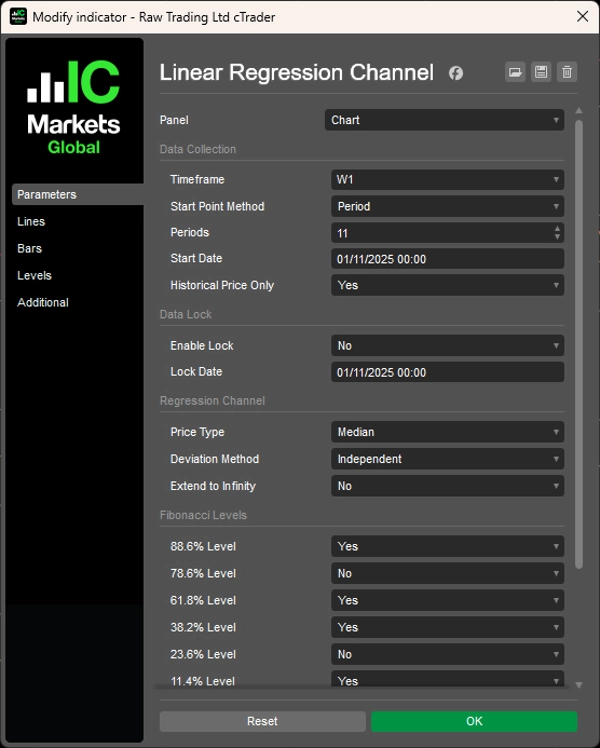
Adatta linee di regressione ai dati di prezzo utilizzando la Modalità Periodo (ultime N barre), la Modalità Data/Ora (da date specifiche) o il Meccanismo di Blocco per congelare l'analisi in punti storici mentre il prezzo continua.
Tre metodi di deviazione (Media, Indipendente, Massima) per canali simmetrici e asimmetrici, sei livelli di ritracciamento di Fibonacci (dal 11,4% all'88,6%), analisi multi-timeframe, sei tipi di prezzo (Apertura/Alto/Basso/Chiusura/Mediano/Tipico), modalità solo storica per backtesting stabile e proiezione estesa all'infinito offrono un'analisi di regressione completa per i trader che mirano a zone di ritorno alla media e confini statistici di prezzo in diverse condizioni di mercato.
CARATTERISTICHE
Selezione Dati Flessibile
- Modalità Periodo: Analizza le ultime N barre (es. ultime 12 candele mensili)
- Modalità Data/Ora: Inizia da eventi di mercato o date specifiche
- Meccanismo di Blocco: Congela l'analisi in un punto storico mentre il prezzo continua
- Multi-Timeframe: Disegna la regressione da qualsiasi timeframe sul tuo grafico attuale
Metodi di Deviazione Intelligenti
- Media: Livelli bilanciati usando deviazioni medie—ideale per zone di trading
- Indipendente: Canali asimmetrici che si adattano alla volatilità direzionale
- Massima: Mostra confini di prezzo estremi per un'analisi a gamma completa
Strumenti di Analisi Professionali
- 6 livelli di ritracciamento di Fibonacci (11,4%, 23,6%, 38,2%, 61,8%, 78,6%, 88,6%)
- 6 tipi di prezzo: Apertura, Alto, Basso, Chiusura, Mediano, Tipico
- Modalità solo storica: Esclude barre in formazione per backtesting stabile
- Opzione estendi all'infinito per proiezioni a lungo termine
Personalizzazione Completa
- Personalizzazione completa dei colori per tutti gli elementi del canale
- Controllo indipendente sulla linea di regressione e sulle bande di deviazione
- Presentazione visiva pulita per un'analisi focalizzata
Capacità Avanzate
- Funzione di blocco per studi di analisi basati su eventi
- Combina struttura di timeframe superiore con esecuzione in timeframe inferiore
- Opzioni di canale simmetriche e asimmetriche per diverse condizioni di mercato
__________________________________________________________________________________________
ALTRI INDICATORI GRATUITI
Esplora un'ampia gamma di strumenti di analisi di mercato—dalla struttura e volume alla regressione, volatilità e timeframe personalizzati.
Il codice sorgente è disponibile nel repository GitHub.
Tutti gratuiti da usare. Ma se vuoi offrire un supporto per un caffè, puoi farlo qui.
Supporto/Resistenza
Volume
- Profiler di Attività di Volume
- Analizzatore di Efficienza del Volume
- Analitica del Profilo di Volume
- Profilo di Volume - Aggiornato
- Analisi della Distribuzione del Volume
- VWAP (Prezzo Medio Ponderato per il Volume)
Medie Mobili
- Canale SSL
- Media Mobile Ancorata
- Media Mobile Scalata per Deviazione
- Attivatore Gann High Low
- Linea di Tendenza Istantanea
- Media Mobile Adattiva Kaufman con Visione di Tendenza
- Canale Media Mobile
- Suite di Medie Mobili
- Media Mobile Canale di Tendenza
Utility/Personalizzati
Basato su Regressione
Volatilità
Oscillatori
__________________________________________________________________________________________
DICHIARAZIONE DI NON RESPONSABILITÀ
Il trading comporta rischi. Questo indicatore è destinato solo all'analisi tecnica — applica sempre una corretta gestione del rischio e opera responsabilmente.
FEEDBACK E MIGLIORAMENTI
Se hai suggerimenti, richieste di funzionalità o idee per miglioramenti, lascia un commento nella scheda Discussione. Il tuo feedback aiuta a migliorare l'indicatore per tutti.
Riepilogo
Recensioni dei clienti
5 | 100 % | |
4 | 0 % | |
3 | 0 % | |
2 | 0 % | |
1 | 0 % |