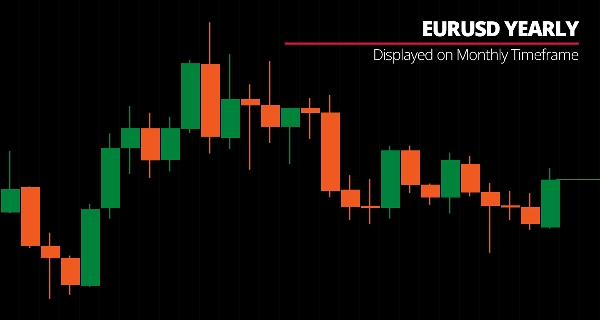
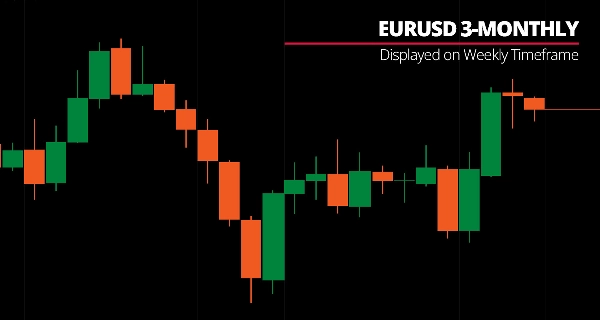
Broker e prop firm
Per le aziende
00
Days
:
00
Hours
:
00
Minutes
:
00
Seconds
Custom Timeframes
Indicatore
128 download
Version 1.2, Dec 2025
Windows, Mac
5.0
Recensioni: 1
Da 20/12/2024
Installazioni gratuite
3496
Immagine caricata di "Custom Timeframes"Immagine caricata di "Custom Timeframes"Immagine caricata di "Custom Timeframes"Immagine caricata di "Custom Timeframes"Immagine caricata di "Custom Timeframes"Immagine caricata di "Custom Timeframes"Immagine caricata di "Custom Timeframes"Immagine caricata di "Custom Timeframes"Immagine caricata di "Custom Timeframes"Immagine caricata di "Custom Timeframes"

Display cTrader native timeframes and non-standard periods (5H, 7H, 9H, 4-day, 2-weekly, 3-monthly, yearly) with OHLC lines, moving averages, and Fibonacci levels.


Renders custom period candlesticks on any chart—from 25-minute bars to yearly periods—with full technical analysis overlaid on your custom timeframe.

Comprehensive period options (custom minutes/hours/days/weeks/months), visual bull/bear candlesticks with configurable wick thickness, OHLC line display with bar offset control (-1 completed, 0 forming), seven Fibonacci levels (11.4% to 88.6%) with 38.2%-61.8% equilibrium zone, nine MA types on eight price sources calculated on custom timeframe structure, and toggle controls for rapid feature management deliver flexible multi-timeframe analysis for traders needing periods between standard chart intervals.


FEATURES


Comprehensive Period Options

  • Custom Minute Periods: 25m, 35m, 50m, 55m
  • Custom Hourly Periods: 5H, 7H, 9H-23H (every hour from 5 to 23)
  • Custom Daily/Weekly/Monthly: 4-day, 2-weekly, 3-weekly, 2-monthly, 3-monthly, 4-monthly, 6-monthly, yearly
  • Native Timeframes: All standard periods (m1-Monthly) with enhanced visualization


Custom Timeframe Bars

  • Visual candlesticks for custom periods with bull/bear coloring
  • Configurable wick thickness
  • Clean chart visualization—hide native bars, show only custom period structure
  • Real-time formation tracking


OHLC Lines

  • Display Open/High/Low/Close lines for custom timeframe bars
  • Bar offset control (-1 = last completed bar, 0 = forming bar)
  • Line extension: Extend to current bar or stop at bar close
  • Clear structural reference points


Fibonacci Levels

  • 7 levels (11.4%, 23.6%, 38.2%, 50%, 61.8%, 78.6%, 88.6%) based on custom bar range
  • Equilibrium Zone: Shaded area between 38.2%-61.8% levels
  • Dynamic levels that update with each custom period bar


Moving Average

  • Calculated on custom timeframe price
  • 9 MA types available
  • 8 price types for calculation source
  • Adaptive to custom period structure


Toggle Controls

  • Quick on/off buttons for custom bars, OHLC lines, MA
  • Clean interface for rapid feature management
  • Flexible display configuration


__________________________________________________________________________________________


MORE FREE INDICATORS


Check out my other free indicators, covering a wide range of market analysis tools—from structure and volume to regression, volatility, and custom timeframes.

Source code is available on GitHub repository.

All free to use. But if you feel like sending coffee support, you can route it here.


Support/Resistance


Volume


Moving Averages


Utilities/Custom


Regression-Based


Volatility


Oscillators


__________________________________________________________________________________________


DISCLAIMER

Trading involves risk. This indicator is intended for technical analysis only — always apply proper risk management and trade responsibly.


FEECBACK & IMPROVEMENTS

If you have suggestions, feature requests, or ideas for enhancement, please leave a comment in the Discussion tab. Your feedback helps improve the indicator for everyone.

5.0
Recensioni: 1
5
100 %
4
0 %
3
0 %
2
0 %
1
0 %
Recensioni dei clienti
December 1, 2025
Custom Timeframes creates non-standard bar intervals like M2, M10, H2, H3, giving traders cleaner structure and more flexibility. Stable and accurate, with light-to-moderate load on heavy markets. Great for SMC, trend models and custom strategies. A UI panel and caching would make it even better.
Indices
Commodities
Stocks
Forex
Crypto

Altro da questo autore

VWAP (Volume Weighted Average Price)
Customizable VWAP with flexible reset, three band methods, and full Fibonacci level control.
Fair Value Gap
FVG Detector: Identify and label Fair Value Gaps, with age, status & multi-timeframe support.
Indicatore
FVG
Fibonacci
Fair Value Gap (Extended)
Detect FVGs with age, status, Fibonacci levels, and customizable fill threshold—extended version.
Volume Profile Analytics
Volume distribution analysis with Market Profile TPO integration.
Indicatore
Fibonacci
Simple Pivot Points
Clear pivot levels. Clean S/R zones. Five methods. Any timeframe.
Indicatore
Breakout
Higher Timeframe Candlestick
Overlay a real-time higher-timeframe candle on your chart — color-coded bias without switching TFs.
Indicatore
Indices
Stocks
Commodities
+2
Volume Profile - Updated
Volume distribution analysis with Market Profile TPO integration.
Indicatore
Breakout
Round Number
Plots automatic psychological levels at round-number zones – major structure & liquidity levels.
Indicatore
Indices
Commodities
Stocks
+2
Moving Averages Suite
28-method MA library in one indicator — from classic EMAs to adaptive & zero-lag variants.
Indicatore
Breakout
Fibonacci
Initial Balance
Track Initial Balance ranges across any period with optional Fibonacci levels and projections.
Indicatore
Breakout
Fibonacci
Linear Regression Channel
Statistically-grounded trend channels via linear regression — clear trend & reversal zones.
Indicatore
Bollinger
Trend Channel Moving Average
Complete MA-channel system: colored trend, channel boundaries & equilibrium with 6 Fib zones.

Potrebbe interessarti anche

Pips V4Final
Displays pips from daily open with high/low. Clean, customizable, perfect for quick daily price context.
Indicatore
Grid
Breakout
Commodities
+8
Regime Filter Pro (+ Alerts)
Identifies market trends (-10 to +10) using HMA with volume confirmation. Includes customizable alerts.
Indicatore
Grid
NAS100
XAUUSD
+6
AutoFibRetracement
A powerful overlay tool designed to automatically plot Fibonacci retracement levels based on a custom window.
IR Ichimoku Macd
this indicaotr show distance between Tenkan to Kijun, Close to Kijun and Close to Tenkan 
Indicatore
Indices
Commodities
Stocks
+2
MARainbow
MARainbow gives you the edge with four customizable moving averages—each color-coded for instant recognition.
Indicatore
Indices
Prop
Commodities
+1
Market Session
Market Session Indicator
Indicatore
Breakout
Fx4U.Multi TimeFrame Support & Resistance
Allow trader to visualize Support & Resistance across different timeframes,give trader an overview of the current market
Volume Edge Pro
Pro Volume Profile with Delta, Session Filters & CSV Export. Precision order flow analysis.
Laguerre RSI
Laguerre RSI is based on John EHLERS' Laguerre Filter to avoid the noise of RSI.
Indicatore
Signal
USDJPY
On Balance Volume USD - Combined
See USD demand in one line—Composite OBV fuses six major FX pairs into a clear momentum gauge.
Indicatore
Indices
Stocks
Commodities
+2
Moving Average Channel
Price channel system built on moving averages—track trend direction, momentum shifts, and mean reversion zones.