

present
Registrati e ricevi uno sconto da $50 sul tuo primo acquisto
Trading product for MyZtrade W1 MN zones Indicatore EMA Supertrend, image 1
MyZtrade W1 MN zones
Indicatore
Versione 1.0, Aug 2026
Windows, Mac
Trading product for MyZtrade W1 MN zones Indicatore EMA Supertrend, image 2
Trading product for MyZtrade W1 MN zones Indicatore EMA Supertrend, image 3
Trading product for MyZtrade W1 MN zones Indicatore EMA Supertrend, image 4
Trading product for MyZtrade W1 MN zones Indicatore EMA Supertrend, image 5
Da 28/06/2025

Descrizione

MyZtrade MTF ATR Zones — Zone di Supporto e Resistenza Basate su ATR Multi-Intervallo Temporale

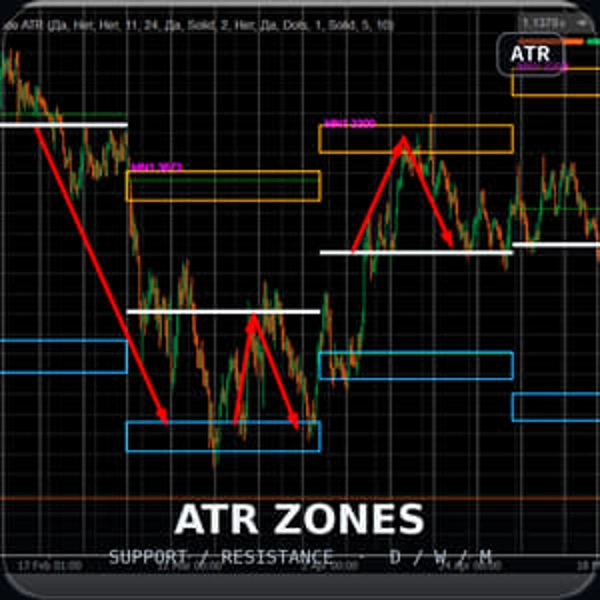
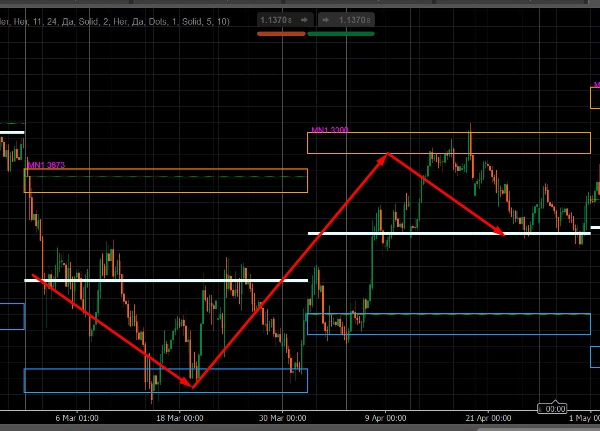
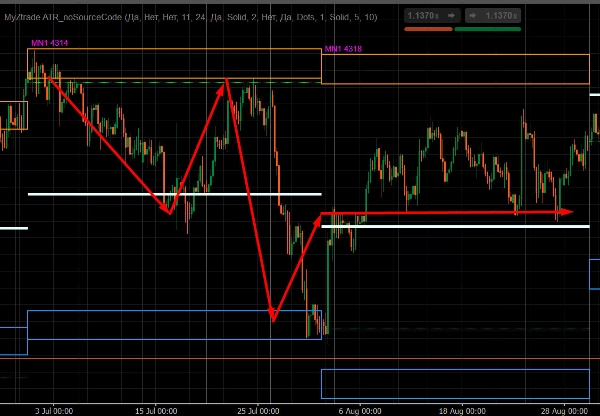
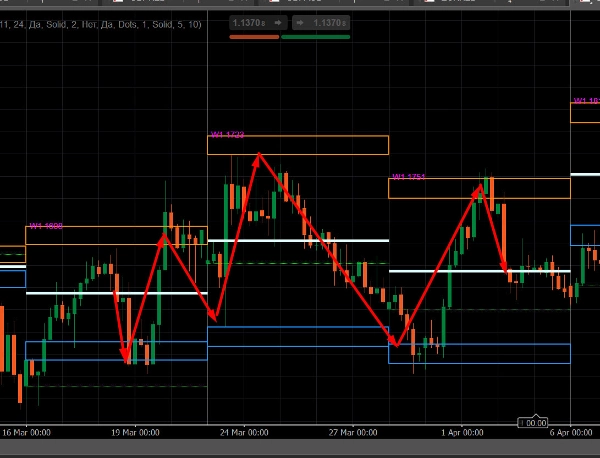
Questo indicatore traccia potenziali zone di inversione (supporto/resistenza) sul grafico basandosi sulla media della gamma High–Low delle barre di intervalli temporali superiori — Mensile, Settimanale e Giornaliero — indipendentemente dall'intervallo temporale del grafico stesso.


Cosa Fa


Per ogni intervallo temporale abilitato (Mensile / Settimanale / Giornaliero), l'indicatore:


• Calcola la gamma media (High–Low) su un numero specificato delle barre più recenti in quell'intervallo temporale (default: 11 barre)


• Traccia sul grafico zone rettangolari di resistenza e supporto, spostate dall'alto/basso di ogni barra del valore di questa gamma media


• Etichetta ogni zona con il valore di volatilità in punti e il prefisso dell'intervallo temporale (per esempio, MN1 2696, W1 1180, D1 340) — utile quando più intervalli temporali sono abilitati contemporaneamente


• Disegna inoltre la linea del prezzo di apertura della barra e la linea mediana all'interno della zona


• Tiene separatamente traccia della barra corrente (non ancora chiusa) — la sua zona si muove in tempo reale mentre la barra si sviluppa


Caratteristiche Principali


• Più intervalli temporali simultaneamente — Mensile, Settimanale e Giornaliero possono essere abilitati indipendentemente l'uno dall'altro


• Non legato all'intervallo temporale del grafico — puoi visualizzare le zone mensili su un grafico orario, ecc.


• Aspetto completamente personalizzabile — colori, spessore e stile delle linee, riempimento/contorno delle zone, dimensione del testo


• Funziona come guida visiva; non genera segnali di trading e non contiene logiche di entrata/uscita

Riepilogo

Riepilogo AI
MyZtrade W1 MN zones is a multi-timeframe indicator that identifies potential reversal zones of support and resistance on trading charts. It calculates the average range (High–Low) over a configurable number of recent bars (default 11) for selected higher timeframes—Monthly, Weekly, and Daily—regardless of the chart’s current timeframe. The indicator then plots rectangular zones offset from each bar’s high and low by this average range, visually marking areas where price reversals may occur.

Each zone is labeled with its volatility value in points and the corresponding timeframe prefix (e.g., MN1, W1, D1) to distinguish multiple enabled timeframes. Additional visual elements include the bar’s opening price line and a median line within each zone. The indicator also tracks the current, developing bar in real time, updating its zone dynamically.

Key features include simultaneous display of multiple timeframes, full customization of visual appearance (colors, line styles, text size), and independence from the chart’s timeframe, allowing monthly zones to be viewed on intraday charts. This tool serves as a visual guide for support and resistance levels based on volatility but does not provide trading signals or entry/exit logic.
Profilo indicatore

Recensioni dei clienti

0.0
Recensioni: 0
Recensioni dei clienti
Questo prodotto non ha ancora ricevuto recensioni. L'hai già provato? Fallo sapere agli altri per primo!

Discussioni

Domande frequenti

EMA
Supertrend
Supply & Demand
ATR
Moving Average
VWAP
Support & Resistance
I prodotti disponibili tramite cTrader Store, inclusi bot di trading, indicatori e plugin, sono forniti da sviluppatori terzi e resi disponibili esclusivamente a scopo informativo e di accesso tecnico. cTrader Store non è un broker e non fornisce consulenze in materia di investimento, raccomandazioni individualizzate o garanzie di risultati futuri.

Altro da questo autore

Indicatore
Volume
Key Levels
+4
Margin Zones its CME-based support/resistance levels from price extremes, helps traders spot entries and exits NKZ zones
Indicatore
Channel
Fibonacci
+5
Market maker levels from key price extremes — catch major reversals and corrections in one click. ver1.2
Indicatore
BOS
CHOCH
+5
MyZTrade High TF candle is a multi-timeframe visualisation tool that overlays completed higher-timeframe candles.

Potrebbe interessarti anche

Indicatore
BOS
Key Levels
+1
Guided by Yahuah Yahusha. 15M: BOS above red (buys)/below green (sells). 4HC reject+BOS. 5M: RBS/SBR. SL wick. TP 1:4.
Indicatore
Forex
Crypto
+2
A powerful cTrader indicator with customizable Moving Average alerts, notifications, and automated trading actions.
Indicatore
ATR
Prop
Outside Candle Detector: Highlights major candles/zones with ATR filter & pattern labels. By Avydel Talbo, prop trader.
Indicatore
AI
ATR
+26
Entry Momentum MACD Power Guide
Indicatore
RSI
MACD
Unlock market insights with our Multi-Timeframe Market Levels indicator, enhancing your trading strategies effortlessly
Indicatore
ATR
Channel
Reversal Trap Probability Bands plots a dynamic volatility envelope around price & automatically detects "trap" reversal
Indicatore
ATR
MSS
+5
Grades ICT Unicorn setups (Breaker Block + FVG confluence) into PRIME / SETUP / WATCH, with retest & RR targets.
Indicatore
Prop
Forex
+4
The Smooth Heiken Ashi indicator is a refined charting tool designed to filter out market noise and highlight true price
Indicatore
RSI
MACD
+2
A straightforward yet effective tool signals entry points for both buying and selling. Include 3 Moving Average
Indicatore
BOS
CHOCH
+5
MyZTrade High TF candle is a multi-timeframe visualisation tool that overlays completed higher-timeframe candles.
Indicatore
MACD
Forex
+2
a revolutionary indicator that integrates volume into MACD.
Indicatore
RSI
Forex
+6
What Constance Brown did with the RSI was to input a momentum calculation within the RSI itself. This the Composite RSI.
Indicatore
Key Levels
Support & Resistance
Draws a colored High/Low/Open/Close box for any custom time range you set — trade breakouts & retests.
Indicatore
RSI
Forex
+12
Indicator pattern signal moment
Indicatore
SMC
Prop
+13
Institutional FVG detection with HTF projection, precise volume deltas, and smart fill logic.
Indicatore
RSI
Prop
+14
Unlock Stochastic RSI PRO in cTrader! Overlay RSI, highlight zones, and identify divergences with customizable settings.
Indicatore
Prop
Forex
+4
Pivot Points Standard — All-in-One Multi-Timeframe Pivot Indicator for cTrader
Indicatore
Signal
Breakout
+1
Bolliger Bands + Hamster-Coder™ Timeframe Decoupling

Prezzo

Da 28/06/2025



















