
Penerangan
GAMBARAN KESELURUHAN
Instantaneous Trendline adalah penunjuk teknikal yang dibangunkan oleh John Ehlers, seorang jurutera elektrik yang menggunakan prinsip pemprosesan isyarat digital (DSP) untuk analisis pasaran kewangan. Pada asalnya diterbitkan dalam majalah Stocks & Commodities (Februari 2002) dan diperincikan dalam bukunya "Rocket Science for Traders" dan "Cybernetic Analysis for Stocks and Futures", penunjuk ini memisahkan komponen tren data harga dengan menapis komponen kitaran (berayun).
KONSEP
Berbeza dengan purata bergerak tradisional yang hanya melicinkan data harga, Instantaneous Trendline menggunakan teknik matematik yang berasal dari kejuruteraan elektrik untuk memecahkan tindakan harga kepada dua komponen berbeza:
- Komponen Tren - Bias arah pasaran
- Komponen Kitaran - Fluktuasi berayun di sekitar tren
Dengan menggunakan penapis notch dan metodologi Transform Hilbert, Ehlers mencipta penunjuk yang bertindak balas dengan cepat terhadap perubahan tren sebenar sambil menapis bunyi dan kitaran jangka pendek. Hasilnya adalah garis tren yang menyesuaikan diri dengan keadaan pasaran dengan kelewatan yang jauh lebih rendah berbanding purata bergerak mudah atau eksponen bagi tempoh yang sama.
Kelebihan utama pendekatan ini adalah ketepatan matematik dalam memisahkan apa yang merupakan "tren" daripada apa yang merupakan "bunyi kitaran," bukan sekadar mengambil purata harga dalam tempoh semakan tetap.
CARA KERJANYA
Penunjuk mengira garis tren yang dilicinkan menggunakan formula rekursif berdasarkan parameter Alpha. Formula ini menggabungkan:
- Data harga semasa dan terkini (titik tengah HL/2)
- Nilai garis tren sebelumnya
- Pekali pelicinan Alpha (lalai 0.07)
Penunjuk juga menghasilkan garis Trigger, iaitu Instantaneous Trendline yang digerakkan sebanyak 2 bar. Garis trigger ini digunakan untuk menjana isyarat dagangan melalui logik persilangan.
TAFSIRAN
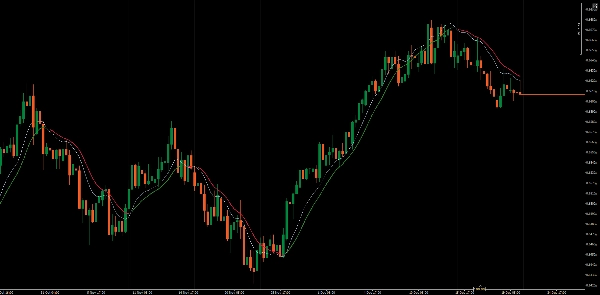
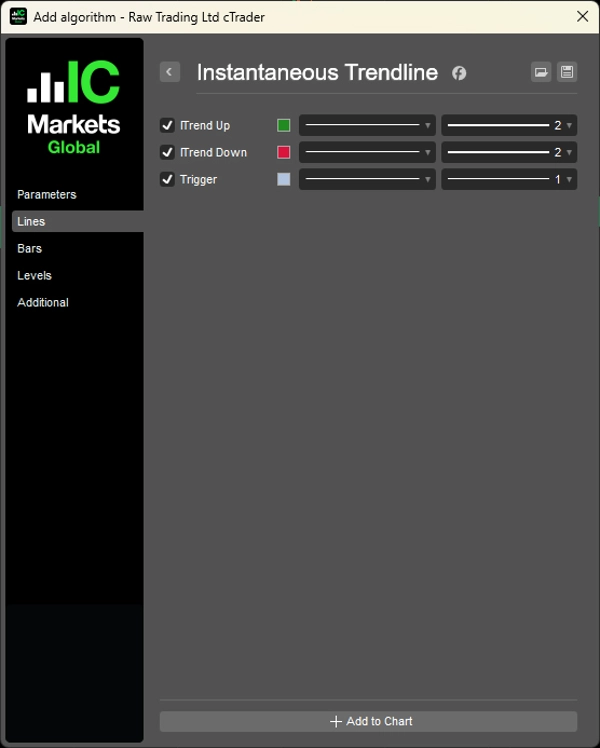
Penunjuk memplot tiga garis:
- ITrend Naik: Dipaparkan apabila Trigger > ITrend, menunjukkan keadaan bullish
- ITrend Turun: Dipaparkan apabila Trigger < ITrend, menunjukkan keadaan bearish
- Trigger: Versi garis tren yang tertunda 2 bar
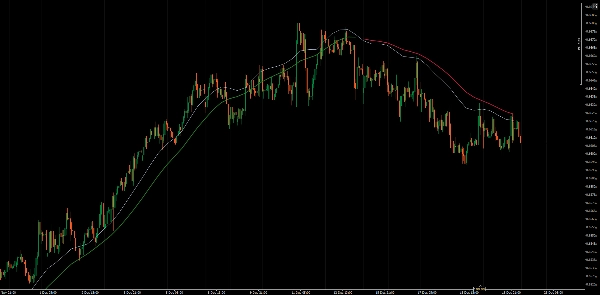
Penjanaan Isyarat:
- Isyarat Bullish: Apabila garis Trigger melintasi di atas Instantaneous Trendline
- Isyarat Bearish: Apabila garis Trigger melintasi di bawah Instantaneous Trendline
Paparan berwarna memudahkan untuk mengenal pasti arah tren semasa dengan cepat.
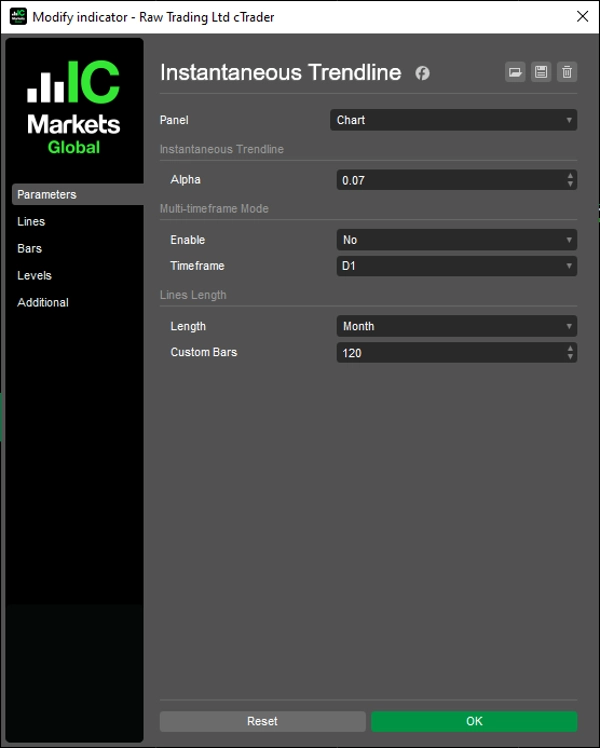
PARAMETER UTAMA
Alpha (0.01 - 1.0, lalai 0.07)
Mengawal pelicinan dan kepekaan garis tren. Nilai yang lebih rendah menghasilkan garis tren yang lebih licin dan bertindak balas lebih perlahan sesuai untuk tren jangka panjang. Nilai yang lebih tinggi meningkatkan kepekaan terhadap perubahan harga tetapi mungkin menghasilkan lebih banyak isyarat palsu dalam pasaran yang tidak menentu. Nilai lalai 0.07 mengimbangi kepekaan dengan penapisan bunyi.
Panjang Garis (lalai 120)
Menentukan berapa banyak bar data garis tren sejarah yang dipaparkan pada carta. Ini membantu mengekalkan carta yang kemas sambil mengekalkan konteks yang mencukupi.
KEKANGAN
- Seperti semua alat pengikut tren, Instantaneous Trendline boleh menghasilkan whipsaws (isyarat palsu) dalam pasaran yang bergerak mendatar atau sisi
- Semasa tren kuat, penunjuk mungkin mengekalkan anda dalam tren lebih lama, tetapi anda mungkin terlepas puncak atau dasar yang tepat
- Prestasi berbeza dengan ketara bergantung pada keadaan pasaran (tren berbanding mendatar)
- Penunjuk adalah reaktif, bukan ramalan - ia mengenal pasti tren selepas ia bermula
__________________________________________________________________________________________
LAGI PENUNJUK PERCUMA
Terokai pelbagai alat analisis pasaran—dari struktur dan volum hingga regresi, volatiliti, dan jangka masa tersuai.
Kod sumber tersedia di repositori GitHub repository.
Semua percuma untuk digunakan. Tetapi jika anda ingin menyokong dengan kopi, anda boleh salurkan ia di sini.
Sokongan/Perlawanan
Volum
- Volume Activity Profiler
- Volume Efficiency Analyzer
- Volume Profile Analytics
- Volume Profile - Updated
- Volume Spread Analysis
- VWAP (Volume Weighted Average Price)
Purata Bergerak
- SSL Channel
- Anchored Moving Average
- Deviation-Scaled Moving Average
- Gann High Low Activator
- Instantaneous Trendline
- Kaufman Adaptive MA with Trend Vision
- Moving Average Channel
- Moving Averages Suite
- Trend Channel Moving Average
Utiliti/Tersuai
Berasaskan Regresi
Volatiliti
Pengayun
__________________________________________________________________________________________
PENAFIAN
Perdagangan melibatkan risiko. Penunjuk ini bertujuan untuk analisis teknikal sahaja — sentiasa gunakan pengurusan risiko yang betul dan berdagang dengan bertanggungjawab.
MAKLUMBALAS & PENAMBAHBAIKAN
Jika anda mempunyai cadangan, permintaan ciri, atau idea untuk penambahbaikan, sila tinggalkan komen di tab Perbincangan. Maklumbalas anda membantu meningkatkan penunjuk untuk semua orang.
Ringkasan
Ulasan pelanggan
5 | 100 % | |
4 | 0 % | |
3 | 0 % | |
2 | 0 % | |
1 | 0 % |


