present
ลงทะเบียนและรับส่วนลด $50 สำหรับการซื้อครั้งแรกของคุณ
Trading product for SC Market Structure อินดิเคเตอร์ Market Structure, image 1
SC Market Structure
อินดิเคเตอร์
107 ดาวน์โหลด
เวอร์ชัน 1.3, Jun 2026
Windows, Mac
5.0
รีวิว: 1
Trading product for SC Market Structure อินดิเคเตอร์ Market Structure, image 2
Trading product for SC Market Structure อินดิเคเตอร์ Market Structure, image 3
Trading product for SC Market Structure อินดิเคเตอร์ Market Structure, image 4
ตั้งแต่ 04/01/2026
357
ติดตั้งฟรี

คำอธิบาย

โครงสร้างตลาด SC

โครงสร้างตลาด SC เป็นตัวบ่งชี้โครงสร้างตลาดแบบภาพที่ออกแบบมาเพื่อระบุและแสดงจุดสูงสุดและต่ำสุดของสวิงที่สำคัญที่สุดโดยอัตโนมัติบนแผนภูมิ

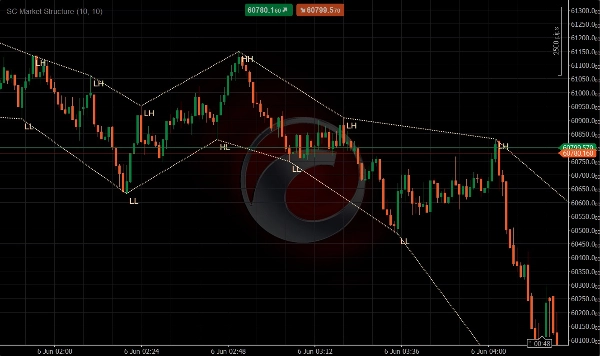
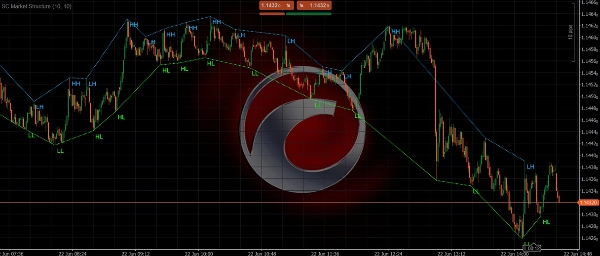
ตัวบ่งชี้จะวิเคราะห์การเคลื่อนไหวของราคาอย่างต่อเนื่องและทำแผนที่วิวัฒนาการของโครงสร้างตลาดโดยเชื่อมต่อจุดสูงและต่ำที่สำคัญด้วยเส้นโครงสร้างแบบไดนามิก ซึ่งช่วยให้เทรดเดอร์สามารถรับรู้ทิศทางแนวโน้ม การต่อเนื่องของแนวโน้ม และจุดกลับตัวที่เป็นไปได้ได้ทันทีโดยไม่ต้องทำเครื่องหมายสวิงตลาดด้วยตนเอง

นอกจากนี้ โครงสร้างตลาด SC ยังจัดประเภทจุดโครงสร้างใหม่ทุกจุดโดยอัตโนมัติตามคำนิยามโครงสร้างตลาดมาตรฐาน:

  • HH (Higher High)
  • HL (Higher Low)
  • LH (Lower High)
  • LL (Lower Low)

โดยการรวมการตรวจจับสวิงอัตโนมัติกับการติดป้ายโครงสร้างตลาดแบบเรียลไทม์ เทรดเดอร์สามารถเข้าใจได้อย่างรวดเร็วว่าตลาดกำลังเป็นแนวโน้มหรือรวมตัว หรือแสดงสัญญาณของการกลับตัวของแนวโน้มที่เป็นไปได้

คุณสมบัติหลัก

• การตรวจจับจุดสูงสุดและต่ำสุดของสวิงที่สำคัญโดยอัตโนมัติ
• เส้นโครงสร้างแบบไดนามิกที่เชื่อมต่อจุดหมุนของตลาด
• การระบุจุดสูงสุดที่สูงขึ้น (Higher Highs - HH) โดยอัตโนมัติ
• การระบุจุดต่ำสุดที่สูงขึ้น (Higher Lows - HL) โดยอัตโนมัติ
• การระบุจุดสูงสุดที่ต่ำลง (Lower Highs - LH) โดยอัตโนมัติ
• การระบุจุดต่ำสุดที่ต่ำลง (Lower Lows - LL) โดยอัตโนมัติ
• การแสดงภาพโครงสร้างตลาดขาขึ้นและขาลงอย่างชัดเจน
• การรับรู้ทันทีของรูปแบบการต่อเนื่องและการกลับตัวของแนวโน้ม
• ใช้งานได้กับทุกตลาดและกรอบเวลา
• การนำเสนอแผนภูมิที่สะอาดและใช้งานง่าย

การแสดงภาพโครงสร้างตลาด

โครงสร้างตลาด SC ประเมินการสวิงของราคาอย่างต่อเนื่องและติดป้ายจุดโครงสร้างที่ได้รับการยืนยันใหม่ทุกจุด

โครงสร้างขาขึ้น

โครงสร้างตลาดขาขึ้นจะถูกระบุเมื่อราคาสร้าง:

• จุดสูงสุดที่สูงขึ้น (Higher Highs - HH)
• จุดต่ำสุดที่สูงขึ้น (Higher Lows - HL)

ลำดับนี้แสดงให้เห็นว่าผู้ซื้อยังคงควบคุมตลาดและแนวโน้มขาขึ้นยังคงอยู่

โครงสร้างขาลง

โครงสร้างตลาดขาลงจะถูกระบุเมื่อราคาสร้าง:

• จุดสูงสุดที่ต่ำลง (Lower Highs - LH)
• จุดต่ำสุดที่ต่ำลง (Lower Lows - LL)

ลำดับนี้แสดงให้เห็นว่าผู้ขายยังคงควบคุมตลาดและแนวโน้มขาลงยังคงอยู่

ตัวบ่งชี้จะเชื่อมต่อจุดโครงสร้างเหล่านี้ด้วยเส้นแนวโน้มแบบไดนามิก ช่วยให้เทรดเดอร์ติดตามวิวัฒนาการของโครงสร้างราคาแบบเรียลไทม์

ทำไมต้องใช้โครงสร้างตลาด SC

การเข้าใจโครงสร้างตลาดเป็นหนึ่งในแง่มุมที่สำคัญที่สุดของการเทรดด้วยการเคลื่อนไหวของราคา

เทรดเดอร์หลายคนวาดจุดสูงสุด จุดต่ำสุด และโครงสร้างแนวโน้มด้วยตนเอง ซึ่งอาจใช้เวลานานและมีความลำเอียง

โครงสร้างตลาด SC ช่วยทำให้กระบวนการนี้เป็นอัตโนมัติโดยการระบุจุดหมุนโครงสร้างอย่างเป็นกลางและติดป้ายตามหลักการโครงสร้างตลาดมืออาชีพ

ซึ่งช่วยให้เทรดเดอร์สามารถ:

• อ่านทิศทางแนวโน้มได้เร็วขึ้น
• ระบุการกลับตัวที่เป็นไปได้ได้เร็วขึ้น
• ยืนยันการตั้งค่าการต่อเนื่องของแนวโน้ม
• ปรับปรุงจังหวะเข้าและออก
• รักษาแผนภูมิให้สะอาดและเป็นระเบียบมากขึ้น

เหมาะสำหรับ

• เทรดเดอร์ที่ใช้ Price Action
• สแคปเปอร์
• เทรดเดอร์รายวัน
• เทรดเดอร์สวิง
• เทรดเดอร์ติดตามแนวโน้ม
• เทรดเดอร์โครงสร้างตลาด
• เทรดเดอร์ Smart Money Concept (SMC)
• เทรดเดอร์ที่ต้องการการวิเคราะห์โครงสร้างอย่างเป็นกลาง

หมายเหตุสำคัญ

โครงสร้างตลาด SC ระบุโครงสร้างตลาดโดยอิงจากจุดสูงสุดและต่ำสุดของสวิงที่ได้รับการยืนยัน ป้ายและเส้นโครงสร้างจะถูกสร้างขึ้นหลังจากจุดหมุนได้รับการยืนยันตามการตั้งค่าการคำนวณที่เลือกเท่านั้น

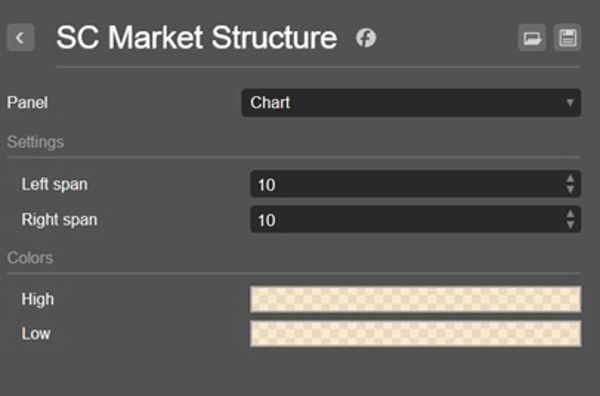
การปรับความไวจะส่งผลต่อความถี่ในการระบุและแสดงจุดโครงสร้างใหม่

แตกต่างจากตัวบ่งชี้ MACD แบบดั้งเดิม แนวคิดภาพของมันถูกสร้างขึ้นโดยการผสานข้อมูลโมเมนตัมเข้ากับการวิเคราะห์การเคลื่อนไหวของราคา ด้วยเหตุนี้ การใช้ตัวบ่งชี้ในแผงแยกจึงไม่แนะนำและไม่ให้ประสบการณ์ผู้ใช้ตามที่ตั้งใจไว้

อ่านแนวโน้ม ติดตามโครงสร้าง เทรดด้วยความมั่นใจ

สรุป

สรุปโดย AI
SC Market Structure is a visual trading indicator that automatically detects and labels key market swings on price charts. It identifies significant swing highs and lows, marking them as Higher Highs (HH), Higher Lows (HL), Lower Highs (LH), and Lower Lows (LL) according to standard market structure definitions. The indicator dynamically connects these points with trend lines, enabling traders to visualize bullish and bearish structures in real time.

By continuously analyzing price action, SC Market Structure helps traders quickly determine trend direction, recognize trend continuation, and spot potential reversal points without manual chart annotations. It supports all markets and timeframes, providing a clean and intuitive chart presentation.

This tool is suited for price action traders, scalpers, day traders, swing traders, trend followers, and those using Smart Money Concepts or seeking objective market structure analysis. Sensitivity settings allow customization of pivot detection frequency. The indicator integrates momentum information into price action analysis and is designed for direct chart overlay rather than separate panels.
โปรไฟล์อินดิเคเตอร์
หมวดหมู่อินดิเคเตอร์
โครงสร้างตลาด (SMC)
ประเภทเอาต์พุต
การแสดงเป็นภาพ
ข้อกำหนดด้านข้อมูล
แท่งเท่านั้น
สัญญาณที่รองรับ
Reversal
ความแข็งแกร่งของแนวโน้ม

รีวิวจากลูกค้า

5.0
รีวิว: 1
5
100 %
4
0 %
3
0 %
2
0 %
1
0 %
รีวิวจากลูกค้า
July 19, 2026
SC MS is an excellent, minimalist tool that automates the tedious process of mapping swing highs and lows. It accurately labels market structure (HH, HL, LH, LL) and connects pivots with clean trend lines, making trend direction and potential reversals instantly recognizable. The adjustable span settings allow customization for any timeframe. While the last unconfirmed swing will naturally repaint until validated, it’s a highly reliable, lightweight overlay for Price Action and SMC traders.

การสนทนา

คำถามที่พบบ่อย

Market Structure
ผลิตภัณฑ์ที่มีให้บริการผ่าน cTrader Store รวมถึงบอทการเทรด อินดิเคเตอร์ และปลั๊กอิน มีให้บริการโดยนักพัฒนาบุคคลที่สามและมีไว้เพื่อวัตถุประสงค์ในการเข้าถึงข้อมูลและทางเทคนิคเท่านั้น cTrader Store ไม่ใช่โบรกเกอร์และไม่ได้ให้คำแนะนำการลงทุน คำแนะนำส่วนบุคคล หรือการรับประกันผลการดำเนินงานในอนาคต

เพิ่มเติมจากผู้เขียนคนนี้

อินดิเคเตอร์
ATR
ATR-based trailing stop that adapts to volatility, protects profits, and follows trends automatically.
อินดิเคเตอร์
ATR
Key Levels
+2
Professional support & resistance detection with adaptive bands and smart signals.
อินดิเคเตอร์
MACD
Dynamic MACD histogram dots with smart crossing signals for faster momentum analysis.
อินดิเคเตอร์
ADX
Minimalist ADX indicator using dynamic dots for a cleaner and faster trend strength visualization.
อินดิเคเตอร์
RSI
Minimalist RSI dots with dynamic colors for instant momentum and extreme zone recognition.

นอกจากนี้คุณยังอาจชอบ

อินดิเคเตอร์
Pin Bar
Inducement
+5
Institutional Nasdaq Session Liquidity Map with Live Point HUD, Sweep Alerts & Interactive Playbook.
"AlphaTrend Pro Max " โลโก้
เรตติ้งสูง
4.8
(5)
$19
/
$29
อินดิเคเตอร์
ATR
RSI
+17
Turn data into precision trades with AlphaTrend Pro Max — advanced trend, signal & structure analysis in one.
"CandleCounterAlex" โลโก้
เรตติ้งสูง
4.7
(4)
$19
อินดิเคเตอร์
CandleCounterAlex – Candle Cycle Counter with Colors and Adjustable Position.
อินดิเคเตอร์
BOS
CHOCH
+5
MyZTrade High TF candle is a multi-timeframe visualisation tool that overlays completed higher-timeframe candles.
อินดิเคเตอร์
ATR
EMA
+5
The indicator displays potential reversal zones (support/resistance) on the chart based on the average range (High–Low)
อินดิเคเตอร์
Forex
BTCUSD
+9
💥Detects moments when the market is "compressed" and about to explode in any direction 💥
อินดิเคเตอร์
AI
ATR
+27
Deep Mood Distribution (DMD) is a segmented volume-profile and sentiment tool that analyzes price action in fixed bar bl
อินดิเคเตอร์
Forex
BTCUSD
+11
Sero is a stochastic-based momentum oscillator that gives clear, color-coded visual signals for market momentum shifts.
อินดิเคเตอร์
AI
ATR
+12
Indicator that auto-calculates SL/TP via volatility. 3 layers: digital filtering, recursive Bayes, adaptive factor
อินดิเคเตอร์
ATR
Forex
+2
Trade fearlessly: auto-adjusts order blocks, manages risks, and ensures precision. Was Free for early users now -80%
"UT Bot" โลโก้
ยอดนิยม
4.4
(5)
$19
/
$20
อินดิเคเตอร์
ATR
Forex
+11
Trend-following indicator with dynamic ATR-based trailing stop for precise entry/exit signals
อินดิเคเตอร์
VWAP
Volume
+4
Advanced Order Flow & Volume Profiling for cTrader. Unveil institutional footprints, Delta, and Anchored VWAPs.
อินดิเคเตอร์
Spread Filter
SpreadSync Entry Timer is a compact cTrader indicator that shows live spread and candle-close.
อินดิเคเตอร์
Flag
VWAP
+5
Session VWAP with statistical deviation bands, gradient cloud, and live rejection alerts — see exactly how stretched pri
อินดิเคเตอร์
RSI
Signal
+1
🚀📈 Plot buy/sell signals on Range Bars using Moving Averages and RSI. Clear, actionable trading insights.🚀📈
อินดิเคเตอร์
Prop
Forex
+4
A precision-crafted indicator that compares current volume to its historical average for the same time of day.
"SMC Liquidity Hunter" โลโก้
เรตติ้งสูง
4.0
(4)
$19
/
$29
อินดิเคเตอร์
ATR
BOS
+4
Based on market structure and draws liquidity zones, institutional flows, and consolidation ranges. Smart Money Concepts
อินดิเคเตอร์
ATR
SMC
+2
Auto Fibonacci Retracement Pro – Smart Swing & Golden Zone Levels

ราคา

ตั้งแต่ 04/01/2026
357
ติดตั้งฟรี