
Penerangan
Penunjuk Corak Hammer – Penjelasan Strategi
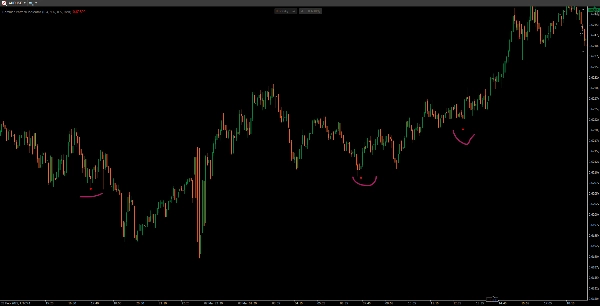
Ini Penunjuk Corak Hammer adalah isyarat pembalikan berasaskan lilin yang mengenal pasti corak hammer menaik dalam tren menurun. Ia direka untuk mengesan kemungkinan pembalikan tren dan menyerlahkan peluang pembelian.
Cara Ia Berfungsi
1️⃣ Mengesan Tren Menurun
- Harga penutupan lilin mesti lebih rendah daripada penutupan 3 bar yang lalu, menunjukkan kemungkinan tren menurun.
2️⃣ Mengesahkan Struktur Lilin Hammer
- Badan Kecil: Badan lilin adalah agak kecil (≤ 30% daripada julat keseluruhan).
- Bayang Bawah Panjang: Wick bawah adalah sekurang-kurangnya 2 kali saiz badan (menunjukkan penolakan kuat terhadap harga yang lebih rendah).
- Bayang Atas Pendek: Wick atas adalah ≤ 30% daripada saiz badan (menunjukkan sedikit rintangan di bahagian atas).
3️⃣ Melakar Isyarat Beli
- Jika semua syarat dipenuhi, satu titik merah (atau warna pilihan) muncul sedikit di bawah paras rendah lilin hammer sebagai pengesahan visual bagi kemungkinan pembalikan.
Ciri-ciri Utama
✅ Menapis isyarat lemah dengan memastikan tren menurun sebelumnya.
✅ Parameter boleh disesuaikan untuk saiz badan, panjang bayang, dan warna.
✅ Corak lilin yang mudah tetapi berkesan untuk pedagang swing dan pedagang tindakan harga.
📌 Penggunaan Terbaik: Sahkan corak hammer dengan penunjuk tambahan (contohnya, volum, paras sokongan) untuk isyarat yang lebih kuat! 🚀
Ringkasan
Ulasan pelanggan
5 | 100 % | |
4 | 0 % | |
3 | 0 % | |
2 | 0 % | |
1 | 0 % |


