
Rsi + Volume
Indikator
707 downloads
Version 1.0, Mar 2025
Windows, Mac
5.0
Bewertungen: 3
Seit 21/02/2025
466.3M
Gehandeltes Volumen
180.83K
Pip-Gewinn
22
Verkäufe
6.92K
Kostenlose Installationen
Beschreibung
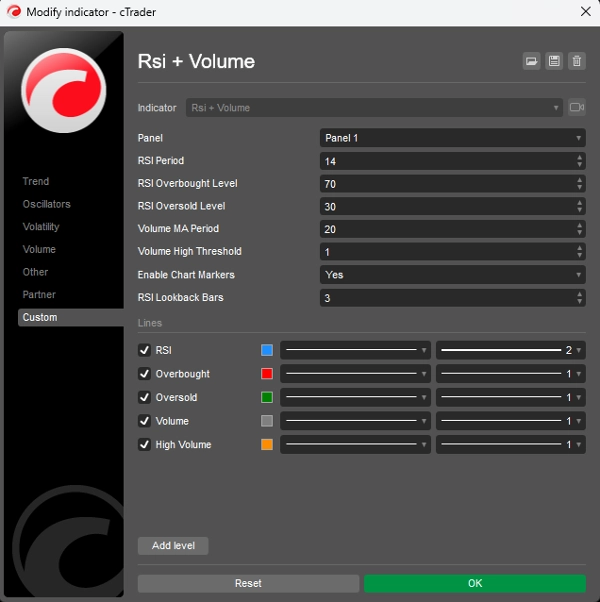
Dieser Indikator kombiniert RSI (Relative Strength Index) mit Volumenanalyse, um zuverlässigere Handelssignale zu erzeugen. Er basiert auf dem Prinzip, dass bedeutende Kursbewegungen von hohem Volumen begleitet sein sollten, um die Stärke der Bewegung zu bestätigen.
Hauptbestandteile:
- RSI-Analyse:
-
- Misst die Geschwindigkeit und Veränderung der Kursbewegungen auf einer Skala von 0-100
- Identifiziert überkaufte Zustände (über 70) und überverkaufte Zustände (unter 30)
- Hilft, potenzielle Umkehrpunkte im Markt zu erkennen
- Volumenanalyse:
-
- Vergleicht das aktuelle Volumen mit einem gleitenden Durchschnitt des jüngsten Volumens
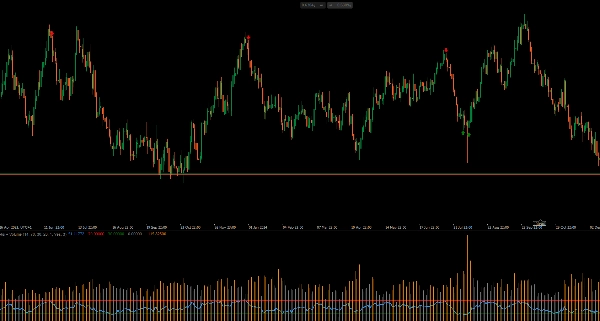
- Hebt Perioden mit hohem Volumen hervor (orangefarbene Histogrammbalken)
- Bestätigt die Stärke hinter Kursbewegungen
- Signalgenerierung:
-
- Kaufsignal: Wenn der RSI das überverkaufte Niveau (30) mit hohem Volumen nach oben kreuzt
- Verkaufssignal: Wenn der RSI das überkaufte Niveau (70) mit hohem Volumen nach unten kreuzt
- Visuelle Signale erscheinen direkt im Chart (grüne Pfeile nach oben für Kauf, rote Pfeile nach unten für Verkauf)
Anwendung:
- Suchen Sie nach Kaufsignalen, wenn der Kurs sich in einem Abwärtstrend befindet und der RSI überverkaufte Zustände anzeigt
- Suchen Sie nach Verkaufssignalen, wenn der Kurs sich in einem Aufwärtstrend befindet und der RSI überkaufte Zustände anzeigt
- Höheres Volumen bestätigt die Stärke des Signals
- Passen Sie die Parameter (RSI-Periode, Volumenschwelle) an Ihren Handelszeitrahmen an
Dieser Indikator hilft, falsche Signale herauszufiltern, indem sowohl eine RSI-Bestätigung als auch überdurchschnittliches Volumen erforderlich sind, was ihn zuverlässiger macht als die alleinige Verwendung des RSI.
Zusammenfassung
KI-Zusammenfassung
The "Rsi + Volume" indicator integrates the Relative Strength Index (RSI) with volume analysis to enhance the reliability of trading signals. It operates on the principle that significant price movements should be confirmed by high trading volume.
Key components include:
1. RSI Analysis:
- Measures the speed and change of price movements on a 0-100 scale.
- Identifies overbought conditions (above 70) and oversold conditions (below 30).
- Helps detect potential market reversal points.
2. Volume Analysis:
- Compares current volume against a moving average of recent volume.
- Highlights periods of high volume using orange histogram bars.
- Confirms the strength behind price movements.
Signal generation occurs when RSI crosses key thresholds with accompanying high volume:
- Buy signals trigger when RSI rises above the oversold level (30) with high volume.
- Sell signals trigger when RSI falls below the overbought level (70) with high volume.
Visual signals appear directly on the chart as green up arrows for buys and red down arrows for sells.
Users can adjust parameters such as RSI period and volume threshold to fit their trading timeframe. This indicator aims to filter out false signals by requiring both RSI confirmation and above-average volume, providing more dependable trade signals than RSI alone.
Indikatorprofil
Kundenbewertungen
5.0
Bewertungen: 3
5 | 100 % | |
4 | 0 % | |
3 | 0 % | |
2 | 0 % | |
1 | 0 % |
Kundenbewertungen
October 12, 2025
Hello, the RSI +volume indicator is perfect, but it needed to have something: when the little arrow appears on the chart, it could show a notification or an alarm. Would you be able to add that alarm or notification in cTrader?
August 12, 2025
Pros: Combines RSI and volume for stronger trading signals. Works well when RSI threshold intersects with high volume spikes. Lightweight and clear visuals. Cons: No alerts or tooltips. Lacks template saving. May generate noise on low-volume timeframes without additional filters.
Diskussion
Häufig gestellte Fragen (FAQ)
Signal
Indices
RSI
Über den cTrader Store verfügbare Produkte, einschließlich Handelsbots, Indikatoren und Plugins, werden von externen Entwicklern bereitgestellt und nur zu Informations- und technischen Zugriffszwecken verfügbar gemacht. cTrader Store ist kein Broker und erbringt keine Anlageberatung, persönlichen Empfehlungen oder eine Garantie für zukünftige Performance.


![„Trend Angle Indicator [Iridio Capital]“-Logo](https://cdn.ctrader.com/image/webp/28a98496-3412-4fea-82eb-be3347bdd6f1_27612)


Preis
Seit 21/02/2025
466.3M
Gehandeltes Volumen
180.83K
Pip-Gewinn
22
Verkäufe
6.92K
Kostenlose Installationen