Renko Moving Average Cross Indicator
指标
623 下载
版本 1.0, Aug 2025
Windows 版、Mac 版
5.0
评价:1
说明
***该指标在默认设置下很少产生信号,但这些信号价值连城!***
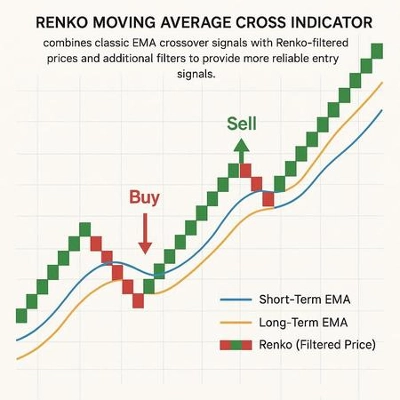
Renko移动平均交叉指标结合了经典的EMA交叉信号与Renko过滤价格及额外过滤器,以提供更可靠的入场信号。
- Renko过滤:使用静态或动态(基于ATR)的砖块大小平滑价格走势。
- EMA交叉:当快速EMA上穿或下穿慢速EMA时生成信号。
- 趋势过滤器:可选的200 EMA用于确认整体趋势方向。
- RSI过滤器:防止在超买或超卖条件下产生信号。
- 信号显示:买卖箭头直接绘制在图表上,并可选择提醒。
👉 目标:识别更高质量的趋势跟踪信号,同时减少市场噪音。
摘要
AI 摘要
The Renko Moving Average Cross indicator integrates classic exponential moving average (EMA) crossover signals with Renko-filtered price data to enhance signal reliability. It smooths price action using static or dynamic (ATR-based) Renko brick sizes, reducing market noise. Signals are generated when a fast EMA crosses above or below a slow EMA, indicating potential buy or sell opportunities. Additional filters include an optional 200 EMA trend filter to confirm overall market direction and an RSI filter to avoid signals during overbought or oversold conditions. Buy and sell signals are displayed directly on the chart as arrows, with optional alert notifications. The indicator aims to identify higher-quality trend-following signals by combining multiple technical tools and filters.
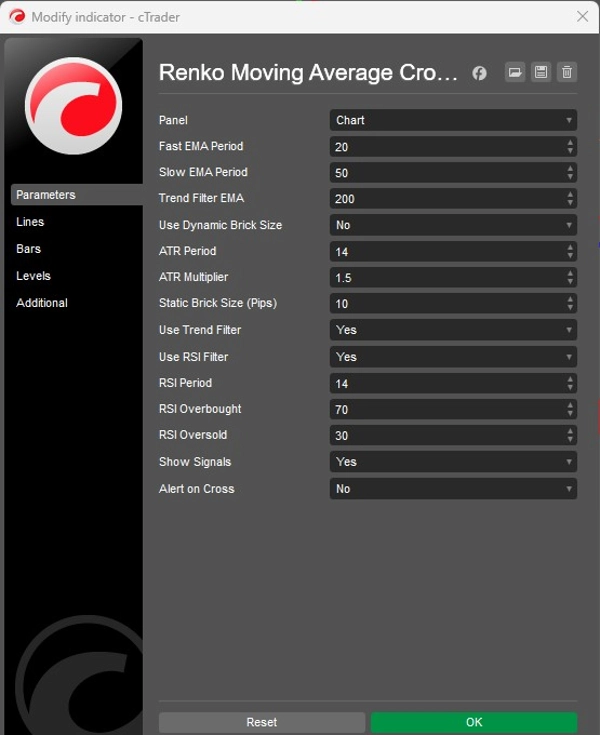
指标配置
客户评价
5.0
评价:1
5 | 100 % | |
4 | 0 % | |
3 | 0 % | |
2 | 0 % | |
1 | 0 % |
讨论
常见问答
cTrader Store 提供的所有产品,包括交易机器人、指标和插件,均由第三方开发者提供,仅供信息参考和技术访问之用。cTrader Store 并非经纪商,不提供投资建议、个人推荐或任何未来业绩保证。


价格
注册日期 21/02/2025
466.3M
交易量
180.83K
盈利点数
22
销售
6.91K
免费安装