
H Capital Liquidity Map Lite V1
指标
249 下载
版本 1.0, Mar 2026
Windows 版、Mac 版
说明
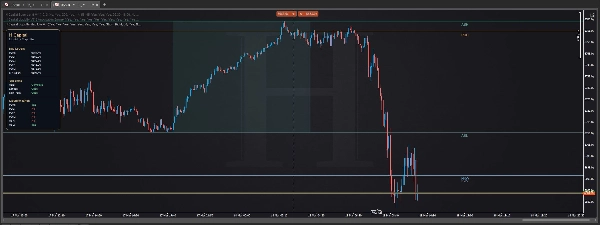
H Capital Liquidity Map Lite 是一款免费的图表工具,专为希望拥有结构而不杂乱的交易者设计。
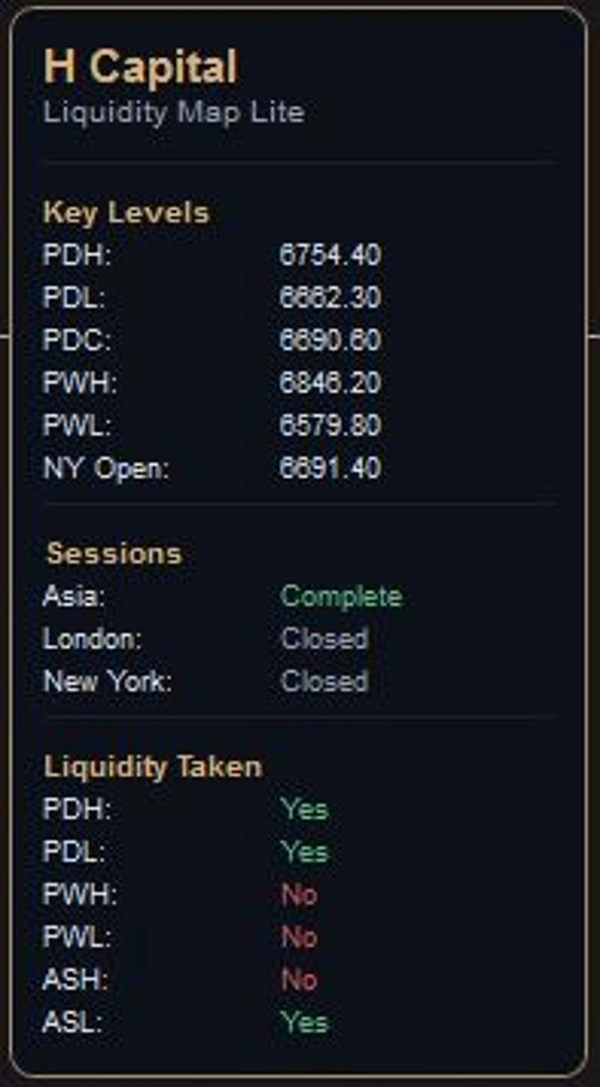
它绘制了许多交易者每天关注的关键市场参考:
- 前一日高点
- 前一日低点
- 前一日收盘价
- 前一周高点
- 前一周低点
- 纽约开盘价
- 亚洲交易时段区间
- 流动性被吸收状态
目标很简单:在执行前为交易者提供一个清晰的框架。
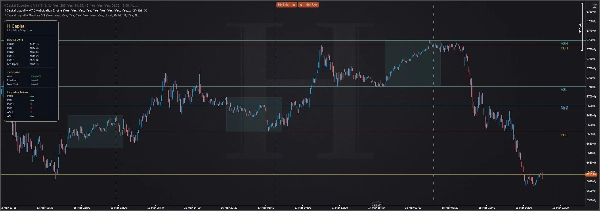
H Capital Liquidity Map Lite 不会用信号淹没图表,而是专注于帮助构建背景的关键水平和交易时段参考。界面采用高级极简风格设计,使图表保持可读,同时信息一目了然。
最适合:
- 指数交易者
- 外汇交易者
- 贵金属交易者
- 基于流动性的交易者
- 喜欢简洁图表的交易者
它的功能:
- 绘制关键的每日和每周流动性水平
- 显示交易时段结构
- 跟踪重要水平是否被突破
- 通过高级图表面板保持信息有序
它不做的事:
- 不生成买卖信号
- 不替代执行判断
- 不作为警报引擎
这不是信号工具。它是专业的市场地图。
摘要
AI 摘要
H Capital Liquidity Map Lite is a charting tool designed to provide traders with a clear, uncluttered view of key daily and weekly liquidity levels. It displays important market references such as the previous day’s high, low, and close; previous week’s high and low; New York open; Asia session range; and liquidity taken status. The tool organizes this information within a minimalist, premium on-chart panel to maintain readability and quick accessibility.
This indicator is suited for traders in indices, forex, metals, and those focusing on liquidity-based strategies who prefer clean chart layouts. It helps build market context by mapping session structures and tracking whether significant levels have been breached. The tool does not generate buy or sell signals, replace execution judgment, or function as an alert system. Instead, it serves as a professional market map to support informed trading decisions.
This indicator is suited for traders in indices, forex, metals, and those focusing on liquidity-based strategies who prefer clean chart layouts. It helps build market context by mapping session structures and tracking whether significant levels have been breached. The tool does not generate buy or sell signals, replace execution judgment, or function as an alert system. Instead, it serves as a professional market map to support informed trading decisions.
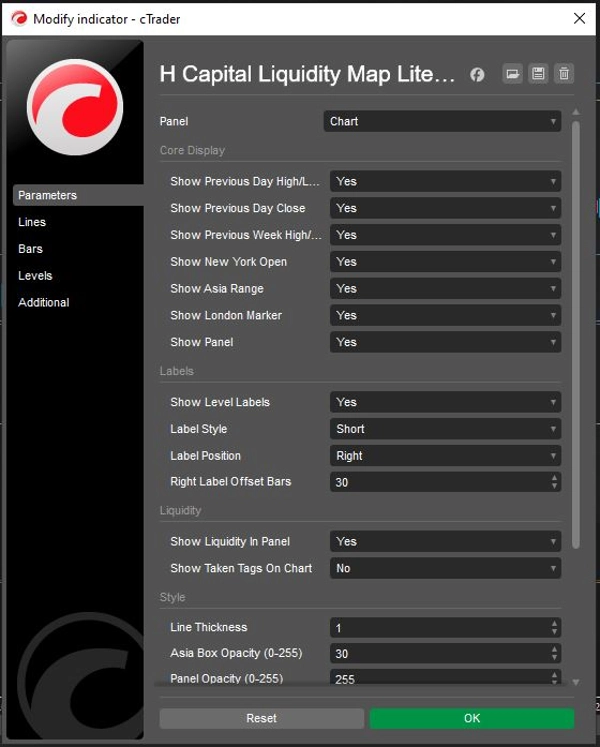
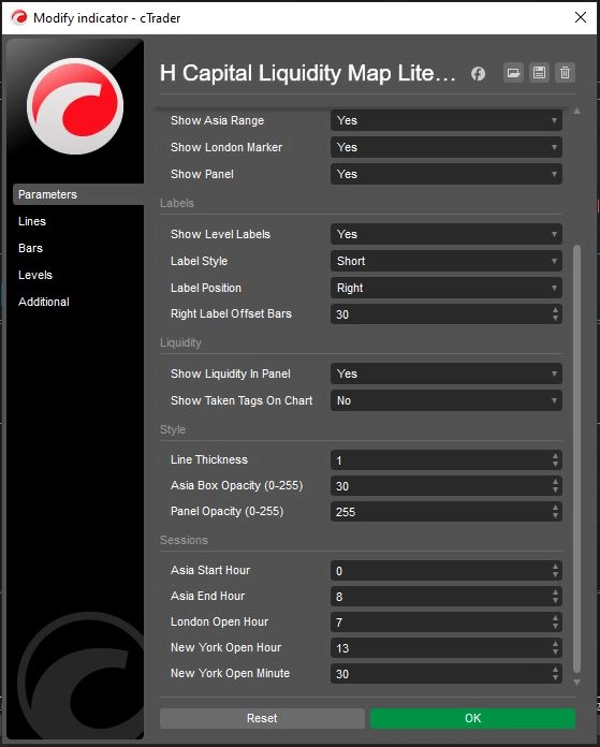
指标配置
客户评价
0.0
评价:0
客户评价
该产品尚无评价。已经试过了?抢先告诉其他人!
讨论
常见问答
Prop
Forex
Indices
Commodities
Crypto
Grid
cTrader Store 提供的所有产品,包括交易机器人、指标和插件,均由第三方开发者提供,仅供信息参考和技术访问之用。cTrader Store 并非经纪商,不提供投资建议、个人推荐或任何未来业绩保证。
猜您喜欢


价格
注册日期 09/03/2026
1.57M
交易量
11.44K
盈利点数
249
免费安装