
Opis
Oto wzór na obliczanie standardowych punktów obrotu (Pivot Points):
PP = (High + Low + Close)/3
S1 = (PP * 2) – High
S2 = PP – (High – Low)
S3 = Low – 2(High – PP)
R1 = (PP * 2) – Low
R2 = PP + (High – Low)
R3 = High + 2(PP – Low)
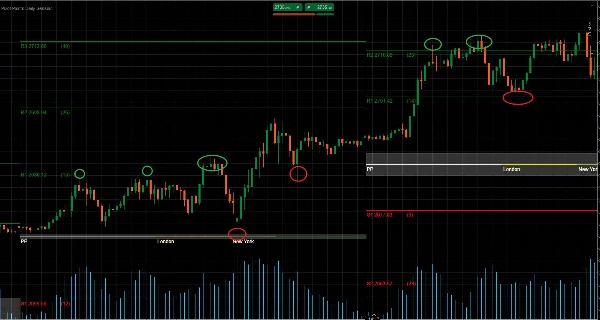
Punkty obrotu mogą być używane do identyfikacji ogólnego trendu, ponieważ ruch przez punkty obrotu w górę wskazuje na trend wzrostowy. Natomiast odwrotna sytuacja, gdy cena nadal spada poniżej punktów obrotu podczas sesji, wskazuje na trend spadkowy.
Na rynku o charakterze bocznym, traderzy mogą po prostu sprzedawać (zajmować krótką pozycję) przy oporze i kupować (zajmować długą pozycję) przy wsparciu. Na przykład, jeśli rynek znajduje się pomiędzy R1 a S1, zlecenia kupna będą składane wokół S1, a zlecenia sprzedaży wokół R1.
Na rynku trendowym odpowiednie punkty obrotu będą służyć jako punkty odniesienia dla korekt, aby wznowić główny trend. Na przykład, jeśli ceny są powyżej PP podczas trendu wzrostowego, ale poniżej R2, traderzy mogą rozważyć składanie opłacalnych zleceń kupna wokół R1.
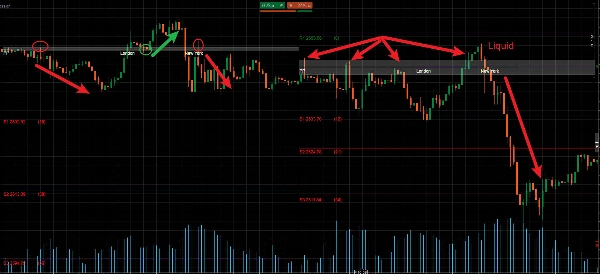
Poziomy wsparcia i oporu w pewnych momentach na rynku zostaną przełamane. Te okresy wybicia mogą oferować wiele okazji handlowych na rynku. Punkty obrotu mogą być również używane do handlu potencjalnymi wybiciami cenowymi na rynku.
Wybicia cenowe występują, gdy cena przebija istniejący poziom wsparcia lub oporu i skutecznie zmienia jego rolę. Na przykład, jeśli nastąpi wybicie w dół na poziomie S2, linia pivot przestanie być linią wsparcia i będzie teraz uważana za linię oporu.
W takiej sytuacji rozpatrywane będą tylko zlecenia sprzedaży poniżej S2, a inne linie pivot mogą służyć do wyznaczania stop lossów i take profitów. Stop lossy dla zleceń sprzedaży mogą być ustawione powyżej S2 i S1, a cele zysku na poziomie S3 i poniżej.
中文说明:
枢轴点可用于识别整体趋势,因为价格向上突破枢轴点表明上升趋势。与此同时,相反的情况,即价格在交易时段内持续跌破枢轴点,则表明下降趋势。
在区间震荡市场中,交易者可以简单地在阻力位做空(卖出)和在支撑位做多(买入)。例如,如果市场在R1和S1之间波动,买单将放置在S1附近,卖单放置在R1附近。
在趋势市场中,相关的枢轴点将作为回调市场恢复主要趋势的参考点。例如,如果在上升趋势中价格高于PP但低于R2,交易者可以考虑在R1附近设置有利可图的买单。
支撑位和阻力位在某些市场情况下必然会被突破。这些突破期可以在市场中提供许多交易机会。枢轴点也可用于交易市场中潜在的价格突破。
价格突破发生在价格冲破现有的支撑位或阻力位并有效转换其角色时。例如,如果在S2处发生向下突破,该枢轴线将不再是支撑线,而将被视为阻力线。
在这种情况下,只有在S2下方才会考虑卖单,其他枢轴线可以指导止损和止盈的设置。卖单的止损可以设在S2和S1上方,盈利目标设在S3及以下。
Podsumowanie
Opinie klientów
5 | 100 % | |
4 | 0 % | |
3 | 0 % | |
2 | 0 % | |
1 | 0 % |


