
الوصف
ماسح الضغط 🔍📊
1. ما الذي يفعله ماسح الضغط
ماسح الضغط هو أداة للتقلب والاتجاه تقوم بـ:
- كشف متى يكون السوق تحت ضغط / انضغاط التقلب ✅
- عرض متى يتم إطلاق ذلك الضغط إلى التوسع 💥
- قياس اتجاه وقوة حركة السعر الناتجة من خلال قيمة الماسح المرسومة كمدرج تكراري.
يجمع بين:
- حزام سعر على نمط بولينجر،
- قناة تقلب على نمط كيلتنر،
- وخط ماسح قائم على الانحدار الخطي،
لعرض كل من حالات الضغط (مفعّل / مُطلق / محايد) والدافع الاتجاهي (صعود أو هبوط).
2. كيف يعمل (المنطق)
- المصدر
يستخدم المؤشر سعر الإغلاق كمدخل رئيسي. - حزام التقلب الخارجي (على نمط BB)
-
- الأساس = SMA(الإغلاق،
طول BB) - الانحراف =
عامل مضاعفة KC× الانحراف المعياري للإغلاق - الحزام العلوي = الأساس + الانحراف
- الحزام السفلي = الأساس − الانحراف
- الأساس = SMA(الإغلاق،
- قناة التقلب الداخلية (على نمط KC)
-
- المركز = SMA(الإغلاق،
طول KC) - النطاق = إما النطاق الحقيقي أو الفرق بين الأعلى والأدنى (يتم تعيينه بواسطة
استخدام النطاق الحقيقي) - متوسط النطاق = SMA(النطاق،
طول KC) - القناة العلوية = المركز + متوسط النطاق ×
عامل مضاعفة KC - القناة السفلية = المركز − متوسط النطاق ×
عامل مضاعفة KC
- المركز = SMA(الإغلاق،
- حالات الضغط
بمقارنة الحزام الخارجي والقناة الداخلية: -
- الضغط مفعّل – نقاط سوداء عند الصفر
-
- الحزام السفلي > القناة السفلية و الحزام العلوي < القناة العلوية
- الحزام داخل القناة بالكامل → التقلب مضغوط، ضغط مرتفع.
- الضغط مُطلق – نقاط رمادية عند الصفر
-
- الحزام السفلي < القناة السفلية و الحزام العلوي > القناة العلوية
- الحزام خارج القناة بالكامل → التقلب يتوسع بعد الضغط.
- ضغط محايد – نقاط زرقاء عند الصفر
-
- أي تكوين آخر.
- قيمة الماسح (
val)
يعرض المدرج التكراري قيمة الماسح المحسوبة عبر الانحدار الخطي: -
- على آخر
طول KCأشرطة، يجد المؤشر: -
- أعلى قمة،
- أدنى قاع،
- SMA للإغلاق.
- يبني خط وسط ديناميكي:
-
- rangeMid = (الأعلى + الأدنى) / 2
- combinedMid = متوسط(rangeMid, SMA(الإغلاق))
- ثم يحدد:
scannerInput=close−combinedMid\text{scannerInput} = \text{close} - \text{combinedMid}scannerInput=close−combinedMid - يتم تشغيل انحدار خطي على
طول KCأشرطة على هذاscannerInput، والقيمة النهائية عند الشريط الأخير هي قيمة الماسحval.
- على آخر
التفسير:
val > 0→ السعر يضغط فوق خط الوسط → ضغط صعوديval < 0→ السعر يضغط تحت خط الوسط → ضغط هبوطي- التغيرات في
valمن شريط لآخر → زيادة أو نقصان في ذلك الضغط الاتجاهي.
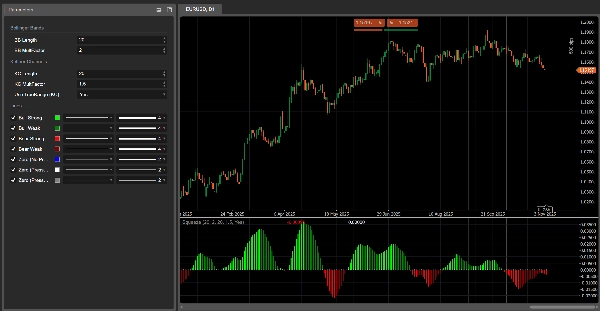
3. كيفية قراءة الألوان
المدرج التكراري – الضغط الاتجاهي (قيمة الماسح)
كل شريط في المدرج التكراري يتوافق مع val ويتم تلوينه كالتالي:
- ليموني –
val > 0ويرتفع (val > val السابق)
→ ضغط صعودي قوي، قيمة الماسح تقوى صعوداً. - أخضر –
val > 0لكن ينخفض (val ≤ val السابق)
→ لا يزال صعودياً، لكن الضغط يتلاشى. - أحمر –
val < 0وينخفض أكثر (val < val السابق)
→ ضغط هبوطي قوي، الدفع نحو الأسفل يتصاعد. - ماروني –
val < 0لكنه يرتفع (val ≥ val السابق)
→ لا يزال هبوطياً، لكن الضغط يفقد قوته.
إذاً:
- فوق 0 → نظام ضغط صعودي
- تحت 0 → نظام ضغط هبوطي
- تغير اللون على نفس جانب الصفر = الضغط يتسارع مقابل يتباطأ.
خط الصفر – حالات الضغط
النقاط المرسومة عند الصفر تظهر حالة الضغط:
- أزرق – ضغط محايد (تقلب عادي)
- أسود – الضغط مفعّل (الانضغاط نشط)
- رمادي – الضغط مُطلق (التوسع بعد الانضغاط)
4. مرجع المعلمات (بالإنجليزية)
طول BB
الفترة المستخدمة لـ SMA والانحراف المعياري في حزام التقلب الخارجي.
- أقصر → حزام أكثر استجابة، تغييرات ضغط أكثر تكراراً.
- أطول → حزام أكثر سلاسة، إشارات أقل لكنها أكثر "كبرى".
عامل مضاعفة BB
مضاعف لانحراف الحزام الخارجي (يُحتفظ به كمعلمة للمستخدم للمرونة).
في هذا الإصدار، سلوك الانحراف مرتبط بـ عامل مضاعفة KC كما في الصيغة الأصلية، لكن يمكنك تعديله إذا أردت نمط حزام مختلف.
طول KC
الفترة لـ:
- خط مركز قناة التقلب،
- تنعيم النطاق،
- نافذة الأعلى/الأدنى وانحدار الماسح.
يحدد إلى أي مدى ينظر ماسح الضغط إلى الوراء لتقدير هيكل التقلب والضغط الاتجاهي.
عامل مضاعفة KC
يتحكم في عرض قناة التقلب والحزام الخارجي.
- قيمة أكبر → قناة أوسع، حالات ضغط مفعّل أقل.
- قيمة أصغر → قناة أضيق، إشارات ضغط أكثر تكراراً.
استخدام النطاق الحقيقي (KC)
- صحيح → نطاق القناة يستخدم النطاق الحقيقي (يلتقط الفجوات والحركات الحادة).
- خاطئ → النطاق هو ببساطة الأعلى − الأدنى.
الملخص
تقييمات العملاء
5 | 0 % | |
4 | 100 % | |
3 | 0 % | |
2 | 0 % | |
1 | 0 % |


