
Opis
🌟 **Co to jest Z-Score?** 🌟
• **Z-Score w handlu**: To sposób na zmierzenie, jak daleko aktualna cena jest od jej niedawnej średniej, wyrażonej w jednostkach odchylenia standardowego. 😊 Wartość bliska 0 wskazuje, że cena jest blisko swojej średniej, podczas gdy wysokie wartości (dodatnie lub ujemne) 😮 wskazują, że cena znacznie się od niej oddaliła.
• **Zastosowanie statystyczne**: Te wartości pozwalają zidentyfikować sytuacje, w których cena jest "przekupiona" 📈 lub "przesprzedana" 📉, co może być przydatne w strategiach powrotu do średniej lub do wykrywania momentów wysokiej zmienności 💥.
🌟 **Jak działa wskaźnik** 🌟
1. **Obliczanie średniej i odchylenia**:
- Analizowana jest określona liczba poprzednich słupków (lub okresów), aby obliczyć średnią cenę zamknięcia oraz jej odchylenie standardowe. 🧮
- Na podstawie tych wartości określa się, jak bardzo aktualna cena odbiega od średniej. Ta różnica jest wyrażana jako Z-Score.
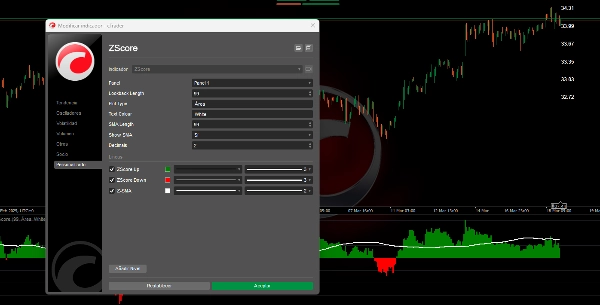
2. **Wizualizacja Z-Score**:
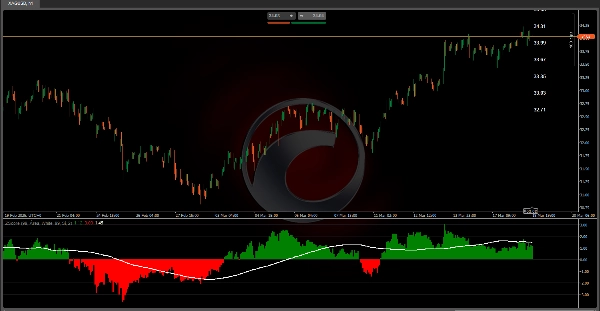
- **Tryb obszaru**: Wyświetlane są dwa histogramy: zielony 🟩 dla wartości dodatnich (gdy cena jest powyżej średniej) oraz czerwony 🔴 dla wartości ujemnych (gdy jest poniżej). Pozwala to wizualnie zidentyfikować wielkość i kierunek odchylenia.
3. **Średnia krocząca Z-Score**:
- Obliczana jest średnia krocząca na podstawie wartości Z-Score. Pomaga to wygładzić wahania i zidentyfikować trendy w zachowaniu odchylenia ceny w czasie. 📊
4. **Strefy prawdopodobieństwa i etykiety odniesienia**:
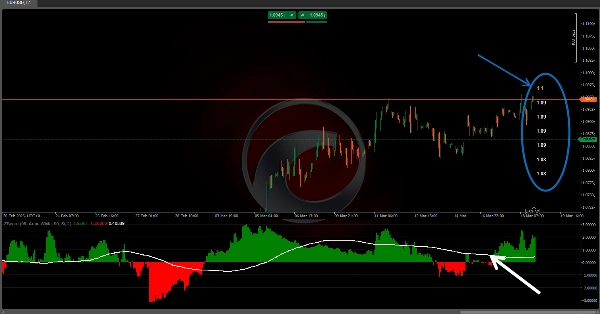
- Dodatkowo na wykresie umieszczone są etykiety pokazujące ceny odpowiadające średniej i poszczególnym poziomom odchylenia. Jest to przydatne do zrozumienia, w kategoriach cenowych, jak "ekstremalnie" zachowuje się rynek. ⚠️
---
🌟 **Interpretacja i zastosowanie dla traderów** 🌟
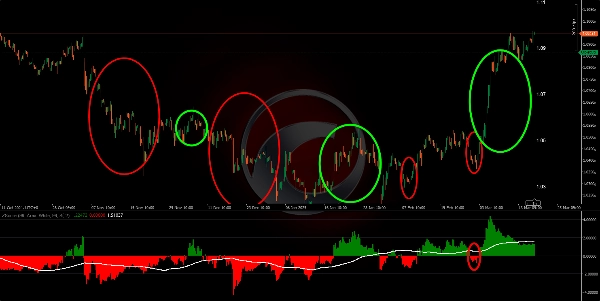
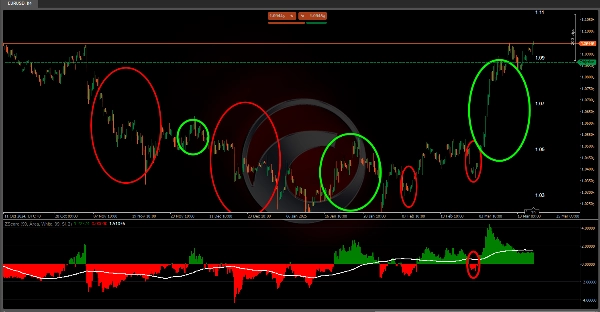
• **Wykrywanie ekstremów**: Obserwując bardzo wysokie lub bardzo niskie wartości wskaźnika, trader może zidentyfikować, że cena znacznie oddaliła się od swojej średniej. Może to sugerować, że korekta jest prawdopodobna (jeśli oczekuje się powrotu do średniej) 🔄 lub że następuje silne wybicie.
• **Potwierdzenie trendu**: Średnia krocząca Z-Score i powiązane pasma pozwalają zobaczyć zmiany w trendzie zachowania ceny względem jej średniej. Przecięcie lub zmiana tych linii może być interpretowana jako sygnał wejścia 🛡️ lub wyjścia.
• **Zarządzanie ryzykiem**: Znając poziomy odchylenia i strefy prawdopodobieństwa, możesz dostosować wielkość pozycji lub określić punkty stop loss ⬇️ i take profit ⬆️, ponieważ masz odniesienie do normalnych i ekstremalnych ruchów.
• **Statystyczne zrozumienie rynku**: Poza byciem narzędziem graficznym, wskaźnik ten zachęca do myślenia o zachowaniu rynku w kategoriach probabilistycznych. Znajomość "normalności" ruchu może być decydującym czynnikiem przy ocenie okazji handlowych. 🎯
🌟 **Podsumowanie** 🌟
Ten algorytm przekształca dane cenowe w reprezentację statystyczną, która pomaga wizualizować i kwantyfikować odchylenie ceny względem jej niedawnego zachowania. Łącząc Z-Score, średnią kroczącą, pasma odchylenia i tabelę prawdopodobieństwa, wskaźnik dostarcza wielowarstwowych informacji. Czyni to go szczególnie wartościowym do identyfikacji momentów, gdy rynek znajduje się w nietypowych warunkach, ułatwiając decyzje o wejściu 🚀, wyjściu 🛑 oraz zarządzaniu ryzykiem na podstawie prawdopodobieństwa i statystyki. 📈📉
Wskaźniki ze sklepu Ctrader:
Dynamic Market Structure
Analysis of Turning Points
Fibonacci Linear
Regression Multi-timeframe
Multi-Level Candle Bias
Tracker
Auto Support and
Resistance Trend Lines
Podsumowanie
Opinie klientów
5 | 100 % | |
4 | 0 % | |
3 | 0 % | |
2 | 0 % | |
1 | 0 % |


![Logo „[Hamster-Coder] Moving Average MTF”](https://cdn.ctrader.com/image/webp/b11b98b1-194d-4b8e-b00e-d611826ad159_31226)