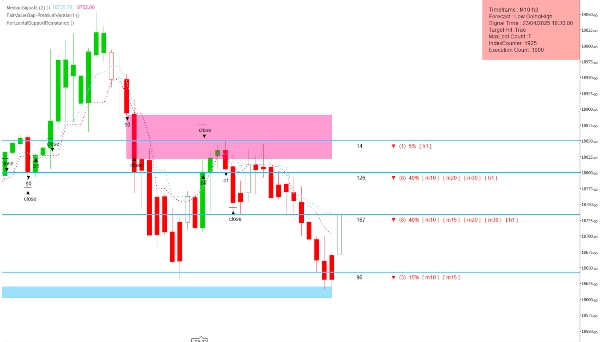
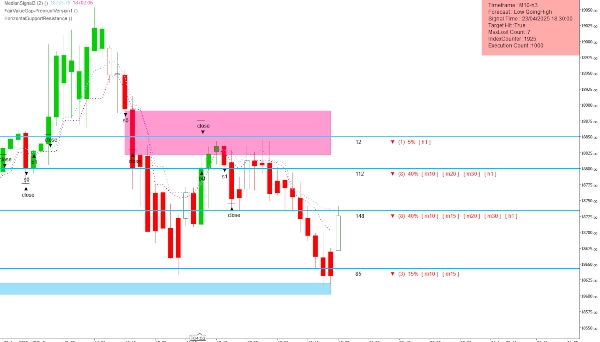
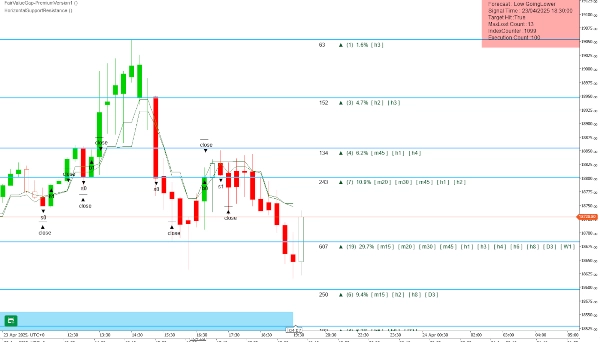
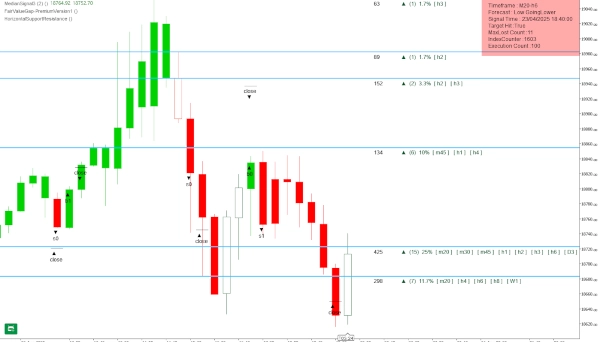
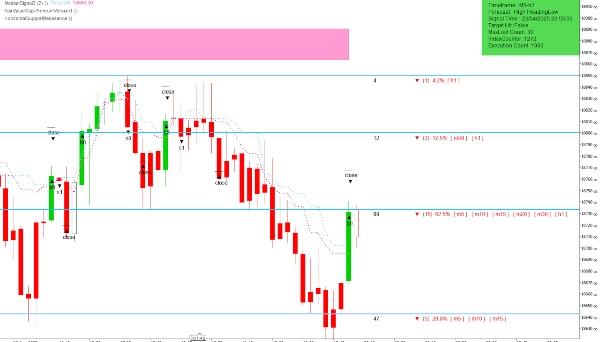
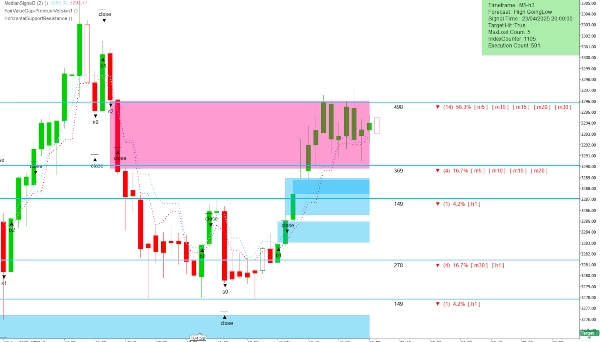
"HorizontalSupportResistance" 로고
HorizontalSupportResistance
4.5
리뷰: 2
"HorizontalSupportResistance" 업로드된 이미지
가입일 19/04/2025
284.21M
거래량
1.07M
핍 수익
8
판매
2.93K
무료 설치

This extraordinary multi timeframe support and resistance indicator is nothing short of market wizardry. Designed with precision and backed by smart logic, it identifies critical price levels on all forex, indices, or stocks but especially on the NASDAQ100 with uncanny accuracy. Like a seasoned trader’s intuition encoded into a visual tool, it highlights key zones where price reacts, reverses, or accelerates—giving you an edge that feels almost supernatural. With clean candlestick representation and vibrant, clearly marked levels, this indicator doesn’t just follow the market—it anticipates it. Whether you're scalping short-term moves or holding longer-term positions, this tool acts like your personal trading oracle, quietly guiding you to smarter, more confident decisions.

Indicator profile
4.5
리뷰: 2
5
50 %
4
50 %
3
0 %
2
0 %
1
0 %
고객 리뷰
August 12, 2025
Pros: Accurate auto SR levels, customizable appearance, lightweight. Cons: No level strength filter, no alerts, possible chart clutter.
June 20, 2025
The Indicator is excellent, What's the core logic of this Indicator, Kindly share if you don't mind.
Forex
Scalping
Indices
GBPUSD
Stocks
Products available through cTrader Store, including trading bots, indicators and plugins, are provided by third-party developers and made available for informational and technical access purposes only. cTrader Store is not a broker and does not provide investment advice, personal recommendations or any guarantee of future performance.

이 작성자의 상품 더 보기

"FairValueGap" 로고
4.5
(2)
무료
This Fair Value Gap (FVG) indicator is a technical analysis tool used to identify potential price imbalances.
This Fair Value Gap (FVG) indicator is a technical analysis on multi-timeframe.
"BarSentiments" 로고
5.0
(2)
무료
This Indicator is a technical analysis tool that measures the strength and direction of market sentiment

좋아하실 만한 다른 항목

🎁 21-Day Full Trial — All Features Unlocked. No limits, no credit card.
Super Trend MA
A next-generation oscillator that redefines how traders interpret momentum by volatility adjusting.
The Fair Value Gap (FVG) Indicator identifies inefficiencies in price action where an imbalance occurs due to aggressive
Engulfing Pattern Indicator
FREE Candlestick Pattern Recognizer
🧠Visually marks momentum zones when the RSI crosses the overbought/oversold thresholds (default 70/30). ✅
Customizable Dynamic Fibonacci Channels and Smart Alerts
Professional EWMA Volatility Indicator - RiskMetrics™ Inspired Exponential Smoothing
Channel Trading is a volatility-based indicator using envelope theory to spot price breakouts and trade signals.
Stochastic RSI (StochRSI) is a technical indicator used to measure the strength and weakness of the RSI.
Laser entries with pivot confirmation. No repaint, all timeframes. Professional results.
Draw a rectangle, label it RRL or RRS. Instant position size, risk, reward targets and full R:R breakdown.
Enhance your trading strategy with our customizable TradingViewMACD indicator. Optimize and elevate your market analysis
MarketStructureOscSignals is a pure price-action signal tool.
📊 Smart Floating Risk Ultimate.Transform Your Risk Management with Real-Time Intelligence.
Logarithmic Framework by LudwigICT
Supertrend indicator change rate
가입일 19/04/2025
284.21M
거래량
1.07M
핍 수익
8
판매
2.93K
무료 설치