
Opis
MFI-MTF: Wskaźnik przepływu pieniędzy na wielu ramach czasowych
Przegląd
MFI-MTF to wskaźnik momentum na wielu ramach czasowych, który wprowadza perspektywę wyższej ramy czasowej do Twojego aktualnego wykresu. Poprzez obliczanie wskaźnika Money Flow Index (MFI) na większej ramie czasowej i wyświetlanie go na Twoim roboczym wykresie, wskaźnik ten pomaga zidentyfikować stany wykupienia i wyprzedania na wielu perspektywach rynkowych bez konieczności ręcznego przełączania się między ramami czasowymi.
Co robi
Analiza wskaźnika Money Flow Index: Wskaźnik mierzy presję kupna i sprzedaży, analizując zarówno ruch cen, jak i wolumen obrotu. Oscyluje między 0 a 100, identyfikując momenty, gdy aktywo doświadczyło nadmiernej presji kupna (wykupienie) lub sprzedaży (wyprzedanie).
Kontekst wyższej ramy czasowej: Zamiast obliczać MFI na aktualnej ramie czasowej wykresu, MFI-MTF pobiera dane z większej ramy czasowej, którą określisz (dzienna, tygodniowa, 4-godzinna itd.). Daje to wgląd na poziomie instytucjonalnym w momentum bez szumu niższych ram czasowych. Na przykład, gdy dzienny MFI pokazuje stan wykupienia, wiesz, że większy trend osiąga wyczerpanie — cenny kontekst dla decyzji o wejściu i wyjściu.
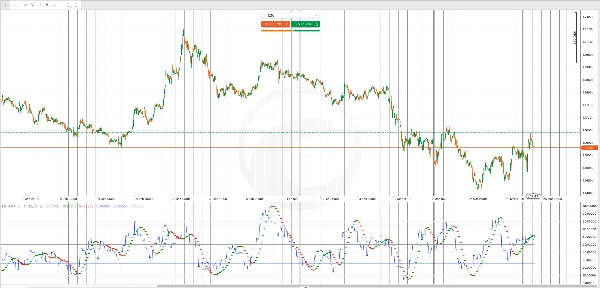
Filtr średniej kroczącej Hulla: Średnia krocząca Hulla (HMA) zastosowana do MFI wygładza fałszywe sygnały i podkreśla zmiany kierunku momentum. Zielone kropki oznaczają wzrosty momentum, a czerwone spadki, dając szybkie wizualne potwierdzenie zmian kierunku momentum.
Kluczowe wyniki
Linia MFI (niebieska): Główna wartość wskaźnika Money Flow Index z wybranej wyższej ramy czasowej, wyświetlana na każdej świecy Twojego aktualnego wykresu.
Sygnały HMA (zielone/czerwone punkty): Zielone punkty pojawiają się, gdy momentum wzmacnia się w górę; czerwone punkty pojawiają się, gdy momentum słabnie lub odwraca się w dół. Służą jako wczesne sygnały ostrzegawcze o potencjalnych zwrotach.
Poziomy odniesienia:
- Poziom wykupienia (domyślnie 70): Gdy MFI przekracza ten poziom, presja kupna jest nadmierna i prawdopodobne są odwrócenia
- Poziom wyprzedania (domyślnie 30): Gdy MFI spada poniżej tego poziomu, presja sprzedaży jest wyczerpana i prawdopodobne są odbicia
- Linia środkowa (50): Neutralny punkt równowagi między momentum byczym a niedźwiedzim
Dostosowanie
Wybór ramy czasowej: Wybierz dowolną ramę czasową wyższą niż aktualna na Twoim wykresie (np. dzienną na wykresie 1-godzinnym). Większe ramy czasowe zapewniają szerszy kontekst trendu, ale rzadsze sygnały; mniejsze przyrosty oferują więcej okazji handlowych, ale z mniejszą perspektywą strategiczną.
Okres MFI: Dostosuj okres patrzenia wstecz dla wskaźnika Money Flow Index (domyślnie 14). Krótsze okresy czynią wskaźnik bardziej responsywnym na ostatnie zmiany wolumenu; dłuższe wygładzają zmienność i redukują fałszywe sygnały.
Okres HMA: Kontroluj wygładzanie filtra momentum. Krótsze okresy czynią zmiany trendu bardziej oczywistymi, ale bardziej hałaśliwymi; dłuższe okresy potwierdzają trendy bardziej niezawodnie, ale z wolniejszym generowaniem sygnałów.
Progi wykupienia/wyprzedania: Dostosuj te poziomy do swojego stylu handlu. Konserwatywni traderzy mogą używać 75/25; agresywni 80/20, aby czekać na bardziej ekstremalne warunki.
Praktyczne zastosowanie
Używaj MFI MTF, aby dodać konfluencję do swoich wejść i wyjść. Sygnał sprzedaży na Twojej roboczej ramie czasowej staje się bardziej wiarygodny, jeśli dzienny MFI jest już wykupiony, co wskazuje, że instytucjonalni sprzedawcy prawdopodobnie działają. Podobnie sygnały kupna zyskują na sile, gdy MFI na wyższej ramie czasowej jest wyprzedany, pokazując, że presja sprzedaży na poziomie makro została wyczerpana.
Zmiany koloru HMA dają Ci alerty w czasie rzeczywistym o zmianach momentum, pomagając wcześnie wychodzić z przegranych transakcji lub zmniejszać wielkość pozycji przed poważnymi odwróceniami.
Podsumowanie
The indicator includes a Hull Moving Average (HMA) filter applied to the MFI to smooth out noise and highlight momentum shifts. Green dots indicate strengthening upward momentum, while red dots signal weakening or downward momentum. Reference levels include default overbought (70), oversold (30), and a neutral midpoint (50), all customizable to fit different trading styles.
Key outputs are the MFI line from the chosen higher timeframe and HMA signals for momentum direction changes. Adjustable parameters include the MFI lookback period, HMA smoothing period, and overbought/oversold thresholds. MFI-MTF aids in confirming entry and exit points by providing institutional-level momentum insights and real-time alerts to momentum shifts on your working chart.
Opinie klientów
5 | 100 % | |
4 | 0 % | |
3 | 0 % | |
2 | 0 % | |
1 | 0 % |


