
الوصف
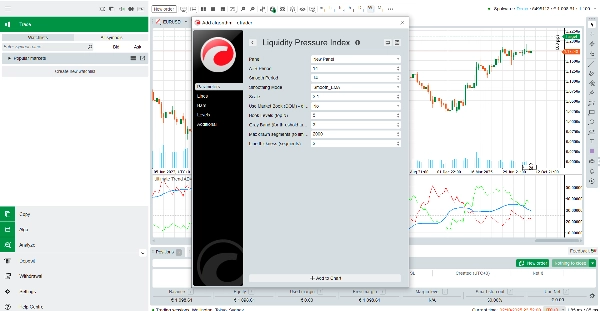
مؤشر ضغط السيولة هو أداة احترافية مصممة لمنح المتداولين نظرة أعمق على الديناميكيات الخفية لسيولة السوق. على عكس المذبذبات التقليدية التي تتفاعل فقط مع السعر، يمزج مؤشر ضغط السيولة بين حجم التيك، وضغط التقلبات، والتدفق الاتجاهي في خط واحد سهل القراءة. هذا يجعله رفيقًا قويًا للمتداولين الذين يرغبون في فهم ما إذا كان ضغط الشراء أو البيع يهيمن حقًا خلف الشموع.
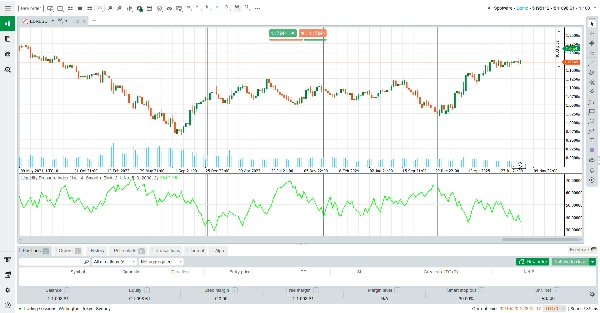
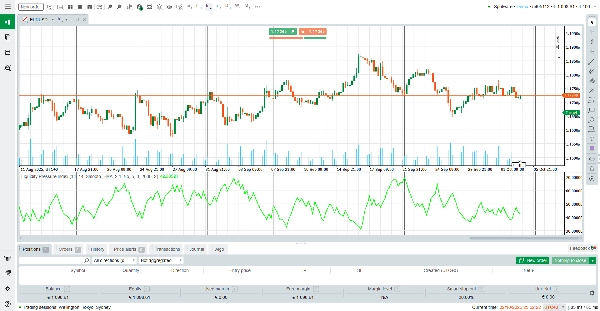
في جوهره، يحسب ALB التوازن بين السيولة المتراكمة للشراء والسيولة المتراكمة للبيع، مع تطبيع النتيجة مقابل حجم التيك المتداول المتحرك. يتمركز الناتج حول المستوى المحايد 50. تشير القيم فوق 50 إلى سيولة شراء أقوى، بينما تبرز القيم تحت 50 سيولة بيع أقوى.
تسمح هذه الإشارة البصرية البسيطة للمتداولين بقياس تدفق الأوامر الأساسي على الفور دون الحاجة إلى تفسير مؤشرات متعددة في وقت واحد.
كيفية قراءة المؤشر
خط فوق 50: يظهر السوق سيولة شراء أقوى. غالبًا ما يدعم هذا استمرار الاتجاه الصعودي أو يشير إلى طلب مخفي يمتص أوامر البيع.
خط تحت 50 : يظهر السوق سيولة بيع أقوى. غالبًا ما يدعم هذا استمرار الاتجاه الهبوطي أو يشير إلى عرض مخفي يمتص أوامر الشراء.
مستوي أو قريب من 50: السيولة متوازنة، مما يشير إلى التردد أو التماسك.
خيارات التنعيم: يمكن للمتداولين الاختيار بين تنعيم EMA أو KAMA لتقليل الضوضاء والتركيز على اتجاه السيولة السائد.
كيف يعمل
يقيس المؤشر أولاً تقلب النطاق الحقيقي (ATR) ويقارنه مع نطاق الشمعة الفعلي لتقدير الضغط. ثم يجمع هذا مع حجم التيك لفصل السيولة المعلقة (الأوامر المنتظرة في السجل) عن السيولة المنفذة (الأوامر التي تم تنفيذها بالفعل). اعتمادًا على اتجاه الشمعة، يخصص الخوارزمية امتصاص شراء أو بيع مخفي. وأخيرًا، يتم تطبيع النتيجة مقابل EMA المتحرك لحجم التيك، وتدرج، وتنعيمها للوضوح.
النتيجة هي مؤشر سيولة ديناميكي يتكيف مع ظروف السوق ويكشف عن الصراع بين المشترين والبائعين في الوقت الحقيقي.
الميزات الرئيسية
رؤية مركزة على السيولة: يتجاوز السعر ليكشف عن ضغط الشراء/البيع المخفي.
تنعيم تكيفي: اختر بين EMA أو KAMA لتقليل الضوضاء.
معلمات قابلة للتخصيص: تحكم في فترة ATR، وطول التنعيم، والمقياس، وسمك الخط.
أداء محسن: تصميم خفيف الوزن مع حدود مقاطع لضمان رسم بياني سلس.
لماذا تستخدم مؤشر ضغط السيولة؟
في الأسواق سريعة الحركة، قد يكون السعر وحده مضللًا. يزود توازن السيولة المتقدم المتداولين بمنظور أعمق، يظهر ما إذا كان السوق مدعومًا حقًا بالسيولة أو إذا كانت التحركات تتم بمشاركة ضعيفة. سواء كنت متداول سكالبير يبحث عن اختلالات قصيرة الأجل أو متداول تأرجح يؤكد قوة الاتجاه، يوفر مؤشر ضغط السيولة عدسة سيولة احترافية—والأفضل من ذلك كله، أنه مجاني تمامًا.
قم بتنزيله اليوم وأضف بعدًا جديدًا من الوضوح لقرارات تداولك.
الملخص
تقييمات العملاء
5 | 0 % | |
4 | 100 % | |
3 | 0 % | |
2 | 0 % | |
1 | 0 % |