
FAMA-MAMA
Wskaźnik
Wersja 1.0, May 2025
Windows, Mac
5.0
Opinie: 1
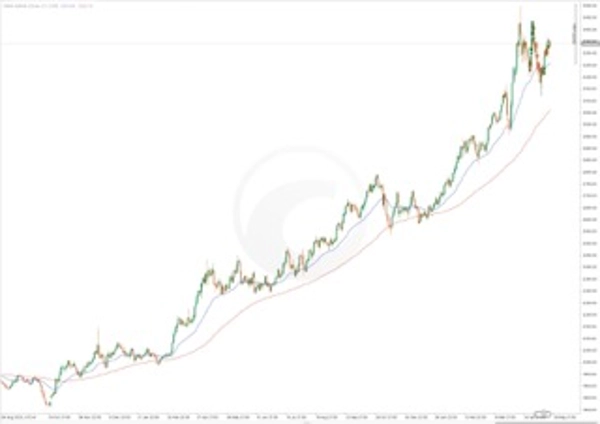
Wskaźnik FAMA-MAMA to dynamiczne, adaptacyjne narzędzie trendowe stworzone dla traderów, którzy potrzebują jaśniejszego wglądu w kierunek rynku. Opierając się na MESA Adaptive Moving Average (MAMA) oraz jej towarzyszącej linii (FAMA), wskaźnik ten dostosowuje się do zmieniających się warunków rynkowych, aby podkreślić zmiany trendu i zredukować szumy na wykresie.
Najważniejsze cechy:
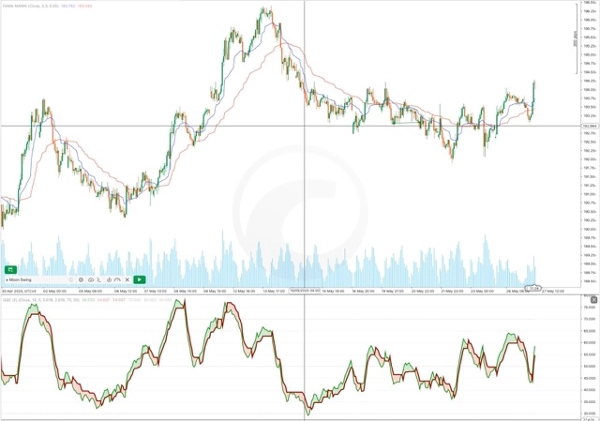
- Adaptacyjne linie trendu: MAMA dostosowuje się do cykli rynkowych, dzięki czemu jest bardziej responsywna w warunkach trendu i bardziej płynna w okresach konsolidacji.
- Wyraźne sygnały przecięcia: Sygnały kupna i sprzedaży generowane są, gdy MAMA przecina FAMA.
- Konfigurowalne ustawienia: Zmieniaj kolory, style linii i czułość, aby dopasować je do swojej strategii i preferencji wizualnych.
- Integracja wizualna: Wyświetla się bezpośrednio na wykresie, ułatwiając rozpoznawanie sygnałów.
Logika sygnałów:
- Gdy MAMA przecina powyżej FAMA → impet wzrostowy
- Gdy MAMA przecina poniżej FAMA → impet spadkowy
Odpowiedni dla różnych stylów handlu, w tym intraday i swing tradingu, ten wskaźnik pomaga traderom śledzić trendy rynkowe z jasnością i pewnością.
Profil wskaźnika
5.0
Opinie: 1
5 | 100 % | |
4 | 0 % | |
3 | 0 % | |
2 | 0 % | |
1 | 0 % |
Signal
Produkty dostępne za pośrednictwem cTrader Store, w tym boty handlowe, wskaźniki i wtyczki, dostarczane są przez deweloperów zewnętrznych i udostępniane wyłącznie w celach informacyjnych oraz w celu zapewnienia dostępu technicznego. cTrader Store nie jest brokerem i nie zapewnia doradztwa inwestycyjnego, nie udziela spersonalizowanych rekomendacji ani nie gwarantuje przyszłych wyników.


![Logo „[Hamster-Coder] Pivot Points MTF”](https://cdn.ctrader.com/image/webp/4c143e5a-309c-40e3-a578-f04d1e133ffa_31159)


![Logo „Gaussian Channel [Iridio Capital]”](https://cdn.ctrader.com/image/webp/7c039209-5573-4a54-a072-f9528b503103_41960)


12
Sprzedaż
406
Bezpłatne instalacje