
VegaXLR - RSI and StochRSI Alerts
Wskaźnik
16 zakupy
Wersja 1.0, Apr 2025
Windows, Mac
4.5
Opinie: 4
Opis
VegaXLR - RSI and StochRSI Alerts to wskaźnik cTrader dostarczający alerty dotyczące zdarzeń RSI i StochRSI, informujący traderów o zmianach na rynku. Powiadamia użytkowników o poziomach wykupienia/wyprzedania, przekroczeniach linii środkowej oraz przecięciach linii K/D, wszystko z możliwością dostosowania ustawień.
Kluczowe funkcje:
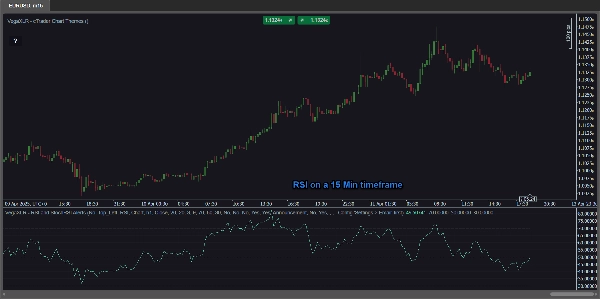
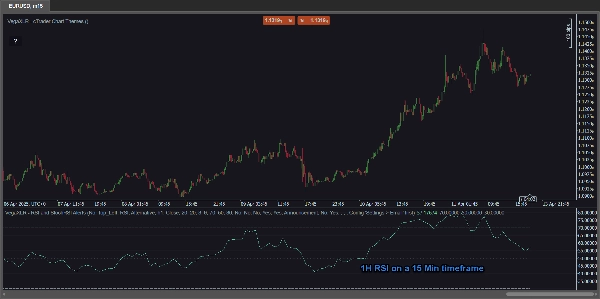
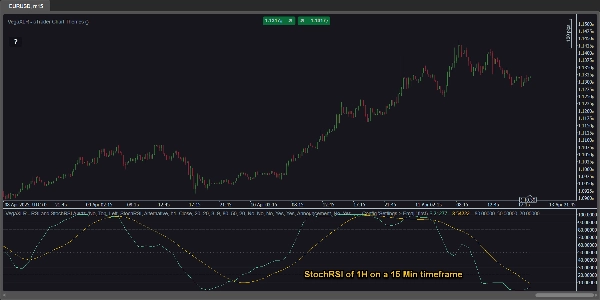
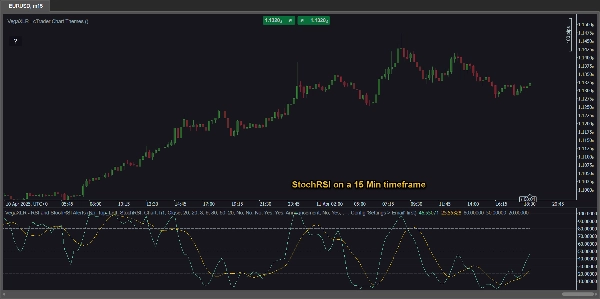
- Analiza wieloczasowa: Unikalna możliwość oglądania wartości RSI i StochRSI z dowolnego interwału bezpośrednio na aktualnym wykresie. Na przykład analizuj RSI z 1-godzinnego interwału podczas przeglądania wykresu 15-minutowego — bez zmiany interwału wykresu!
- Alerty RSI i StochRSI: Otrzymuj powiadomienia o:
-
- Warunkach wykupienia i wyprzedania
- Przekroczeniach linii środkowej (50%)
- Przecięciach linii K i D (StochRSI)
- Dostosowywane ustawienia: Reguluj źródło RSI, okresy, wartości K/D oraz progi alertów dla precyzyjnej kontroli.
- Wszechstronne alerty: Wybierz spośród:
-
- wyskakujących okienek cTrader
- alertów dźwiękowych
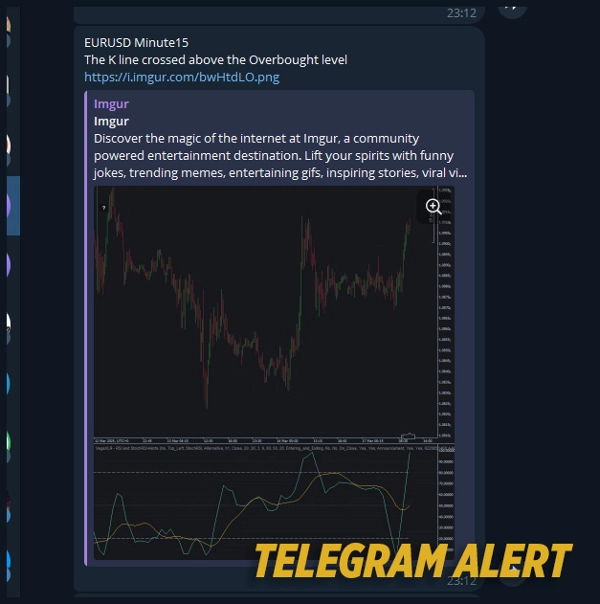
- alertów Telegram (z opcjonalnymi zrzutami ekranu wykresu)
- powiadomień e-mail
- Zintegrowane linie RSI i StochRSI: Nie ma potrzeby instalowania dodatkowych wskaźników — są wbudowane!
Przewodnik szybkiego dostępu: Wygodny przycisk na wykresie otwiera instrukcję użytkownika.
Podsumowanie
Podsumowanie AI
VegaXLR - RSI and StochRSI Alerts is a cTrader indicator designed to monitor and notify traders of key RSI and StochRSI events. It provides alerts for overbought and oversold conditions, centerline (50%) crossovers, and K/D line crossovers within the StochRSI. The indicator supports multi-timeframe analysis, allowing users to view RSI and StochRSI values from any timeframe directly on their current chart without switching timeframes. Customizable settings enable adjustment of RSI source, periods, K/D values, and alert thresholds for tailored monitoring. Alert delivery options include cTrader popups, sound alerts, Telegram notifications (with optional chart screenshots), and email messages. The indicator integrates RSI and StochRSI lines internally, eliminating the need for additional indicators. An in-chart button provides instant access to the user manual for guidance. This tool assists traders in identifying precise market shifts and potential trade entry points based on momentum indicators.
Profil wskaźnika
Opinie klientów
4.5
Opinie: 4
5 | 75 % | |
4 | 0 % | |
3 | 25 % | |
2 | 0 % | |
1 | 0 % |
Opinie klientów
July 23, 2026
Very good and lots of options, Vega is one of the best. The problem is that the indicator no longer sends alerts, making it a bad choice (purchase). Ctrader is saying the coders are to blame for not udating their algos. I agree in part. However, I'm considering saving my money now as they render half of the indictaors obsolete with 6 monts. Ctrader what are you doing? Dont buy this until a 2026 update because it wont work until Vega fixes what ctrader broke.
April 27, 2025
Steady choice for testing for traders who use momentum confirmation. It gives value around oscillator setups, but strong trends can keep signals stretched. A clean test needs 25 oscillator signals, 2 timeframe confirmation and a clear 1R exit plan. The tool is useful when overbought or oversold is treated as context, not a command.
April 26, 2025
April 26, 2025
Good enough to inspect for oscillator setups. it gives a familiar read on overextension and momentum, especially when used for checking stretched conditions before entries. RSI style levels around 30 and 70 help, but I would add a 2 swing divergence check. The tool is useful when overbought or oversold is treated as context, not a command.
Dyskusja
Częste pytania
RSI
Produkty dostępne za pośrednictwem cTrader Store, w tym boty handlowe, wskaźniki i wtyczki, dostarczane są przez deweloperów zewnętrznych i udostępniane wyłącznie w celach informacyjnych oraz w celu zapewnienia dostępu technicznego. cTrader Store nie jest brokerem i nie zapewnia doradztwa inwestycyjnego, nie udziela spersonalizowanych rekomendacji ani nie gwarantuje przyszłych wyników.


![Logo „[Hamster-Coder] Pivot Points MTF”](https://cdn.ctrader.com/image/webp/4c143e5a-309c-40e3-a578-f04d1e133ffa_31159)


Cena
232
Sprzedaż
695
Bezpłatne instalacje